Is Post-pandemic Wage Growth Fueling Inflation? 


Federal Reserve Bank of Boston
Inflation in the UnitedStates surged after the onset of the COVID-19 pandemic, reaching levels not seen in four decades. Supply chain disruptions, extraordinary fiscal support for households, labor market shortages, and lockdowns and other public health measures contributed to this surge, which first manifested as goods price inflation. Nominal wage growth also increased significantly and has remained at levels above pre-pandemic averages, raising concerns that it could trigger a wage-price spiral and extend the current episode of high inflation. Indeed, the increase in wage growth has coincided with an increase in service inflation, which is known to be more persistent than goods inflation and to account for a majority of overall inflation.
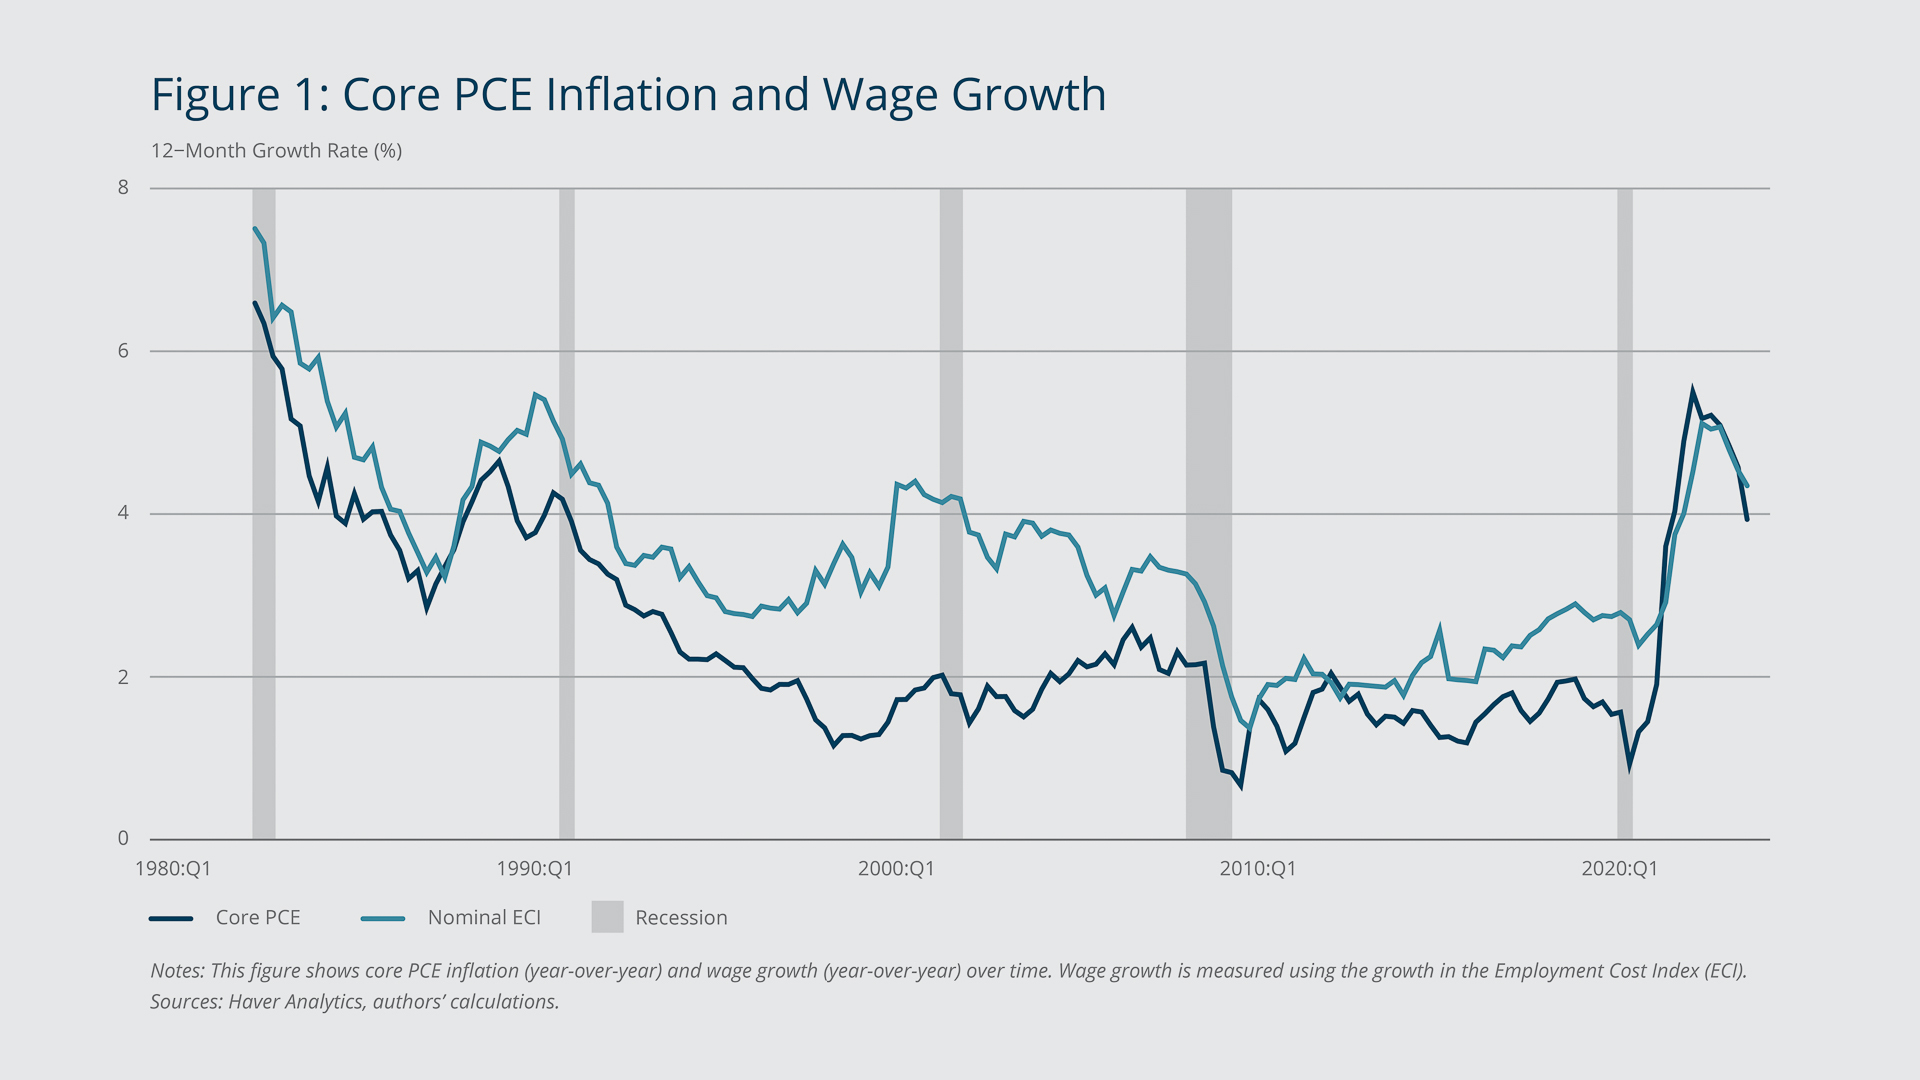
As Figure 1 illustrates, there has been a strong positive correlation between core personal consumption expenditures (PCE) inflation and growth in the Employment Cost Index (ECI) for at least the last four decades, and particularly in 2021 and 2022, when both increased sharply.1 However, as Lorenzoni and Werning (2023) highlight, this recent pattern does not necessarily indicate a wage-price spiral.2
Federal Reserve Bank of Boston
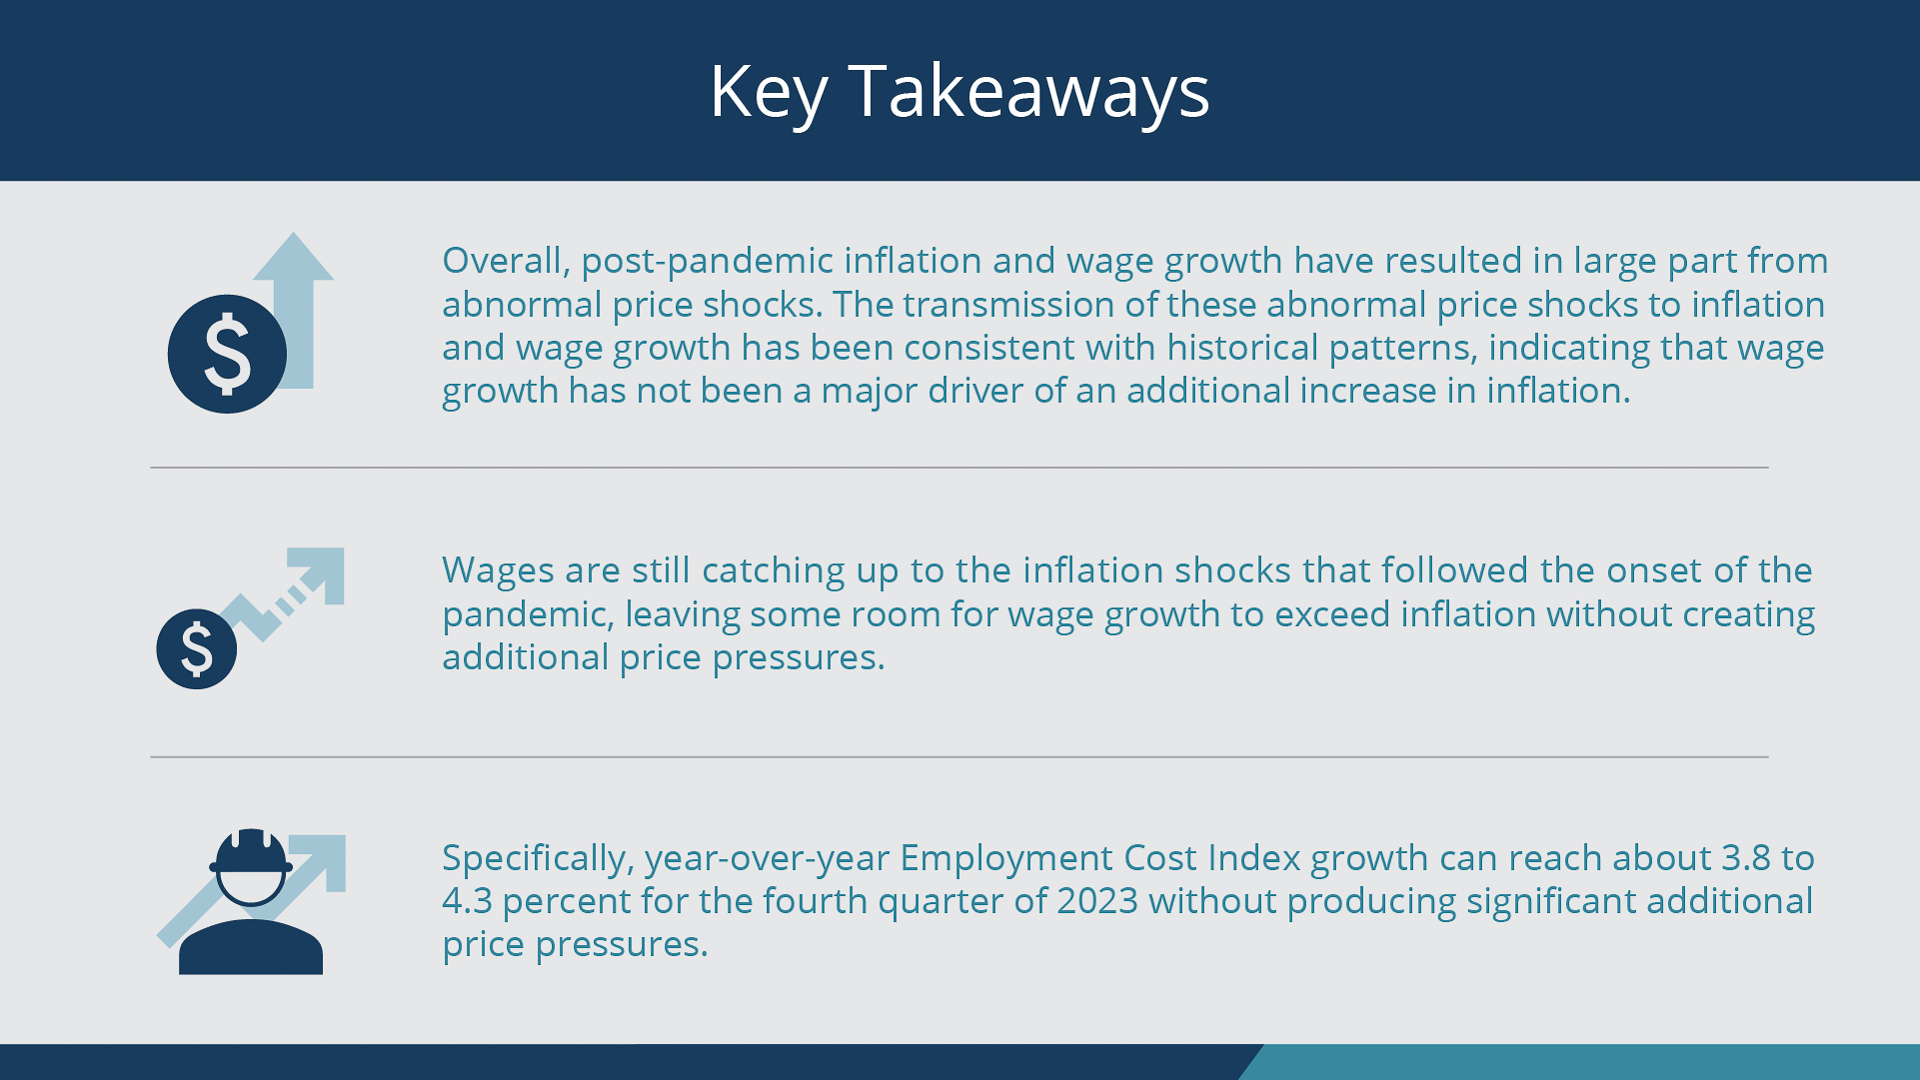
This brief uses historical estimates of the interdependent behavior, or joint dynamics, of prices, wages, and productivity to show that, despite the coincident increases, the sharp rise in wage growth since the end of the pandemic resulted in large part from abnormal inflation shocks and has not triggered a significant additional increase in inflation. Moreover, it documents that wages are still catching up to the inflation shocks that followed the onset of the pandemic, leaving some room for wage growth to exceed inflation without creating additional price pressures.
Sign up for Research Department Updates.
Large Price Shocks Have Fueled Post-pandemic Inflation and Wage Growth
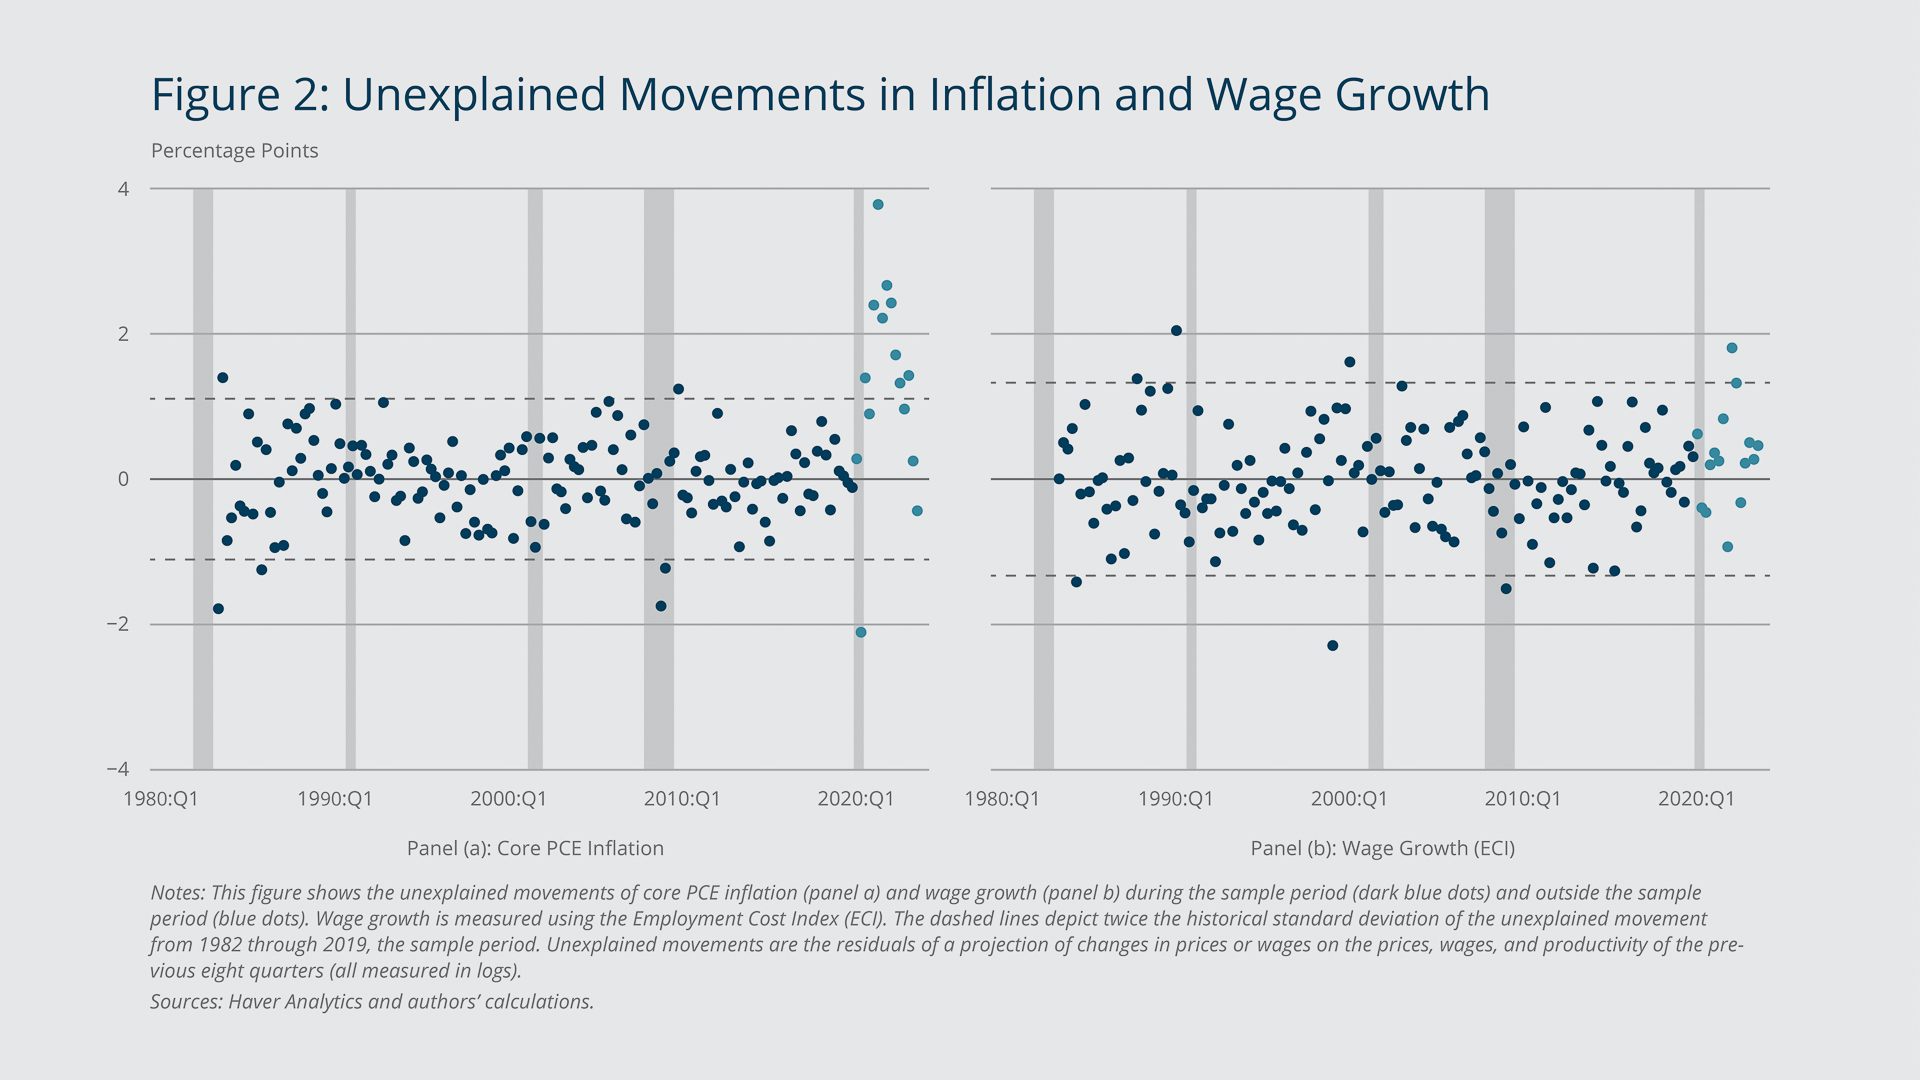
To better understand what generated the recent movements in inflation and wage growth, we model the joint dynamics of those two variables, taking into account productivity dynamics as measured by the growth in real output per worker. We estimate the parameters of the model using quarterly data from 1982:Q1 through 2019:Q4 and compute the residual, or unexplained, movements in inflation and wage growth based on inflation, wage growth, and productivity levels for the sample period and for the 2020:Q1–2023:Q3 period.3, 4
The results are shown in Figure 2. The dark blue dots depict the unexplained movements of inflation (Panel a) and wage growth (Panel b) throughout our estimation period. The light blue dots represent the unexplained movements since 2020:Q1. We find that in our framework, the historical dynamics of prices, wages, and productivity cannot explain the post-pandemic price inflation and that only abnormally large positive shocks can account for it.5 (“Post-pandemic” refers to the period that began with the onset of the pandemic in 2020:Q1.) By contrast, the post-pandemic wage dynamics have been consistent with the historical relationships among wage growth, inflation, and labor productivity growth; abnormally large shocks are not needed to explain the wage dynamics during this period.
Federal Reserve Bank of Boston
Overall, post-pandemic inflation and wage growth have resulted from abnormal price shocks. The transmission of these abnormal price shocks to inflation and wage growth has been consistent with historical patterns, indicating that wage growth has not been responsible for an additional increase in inflation.
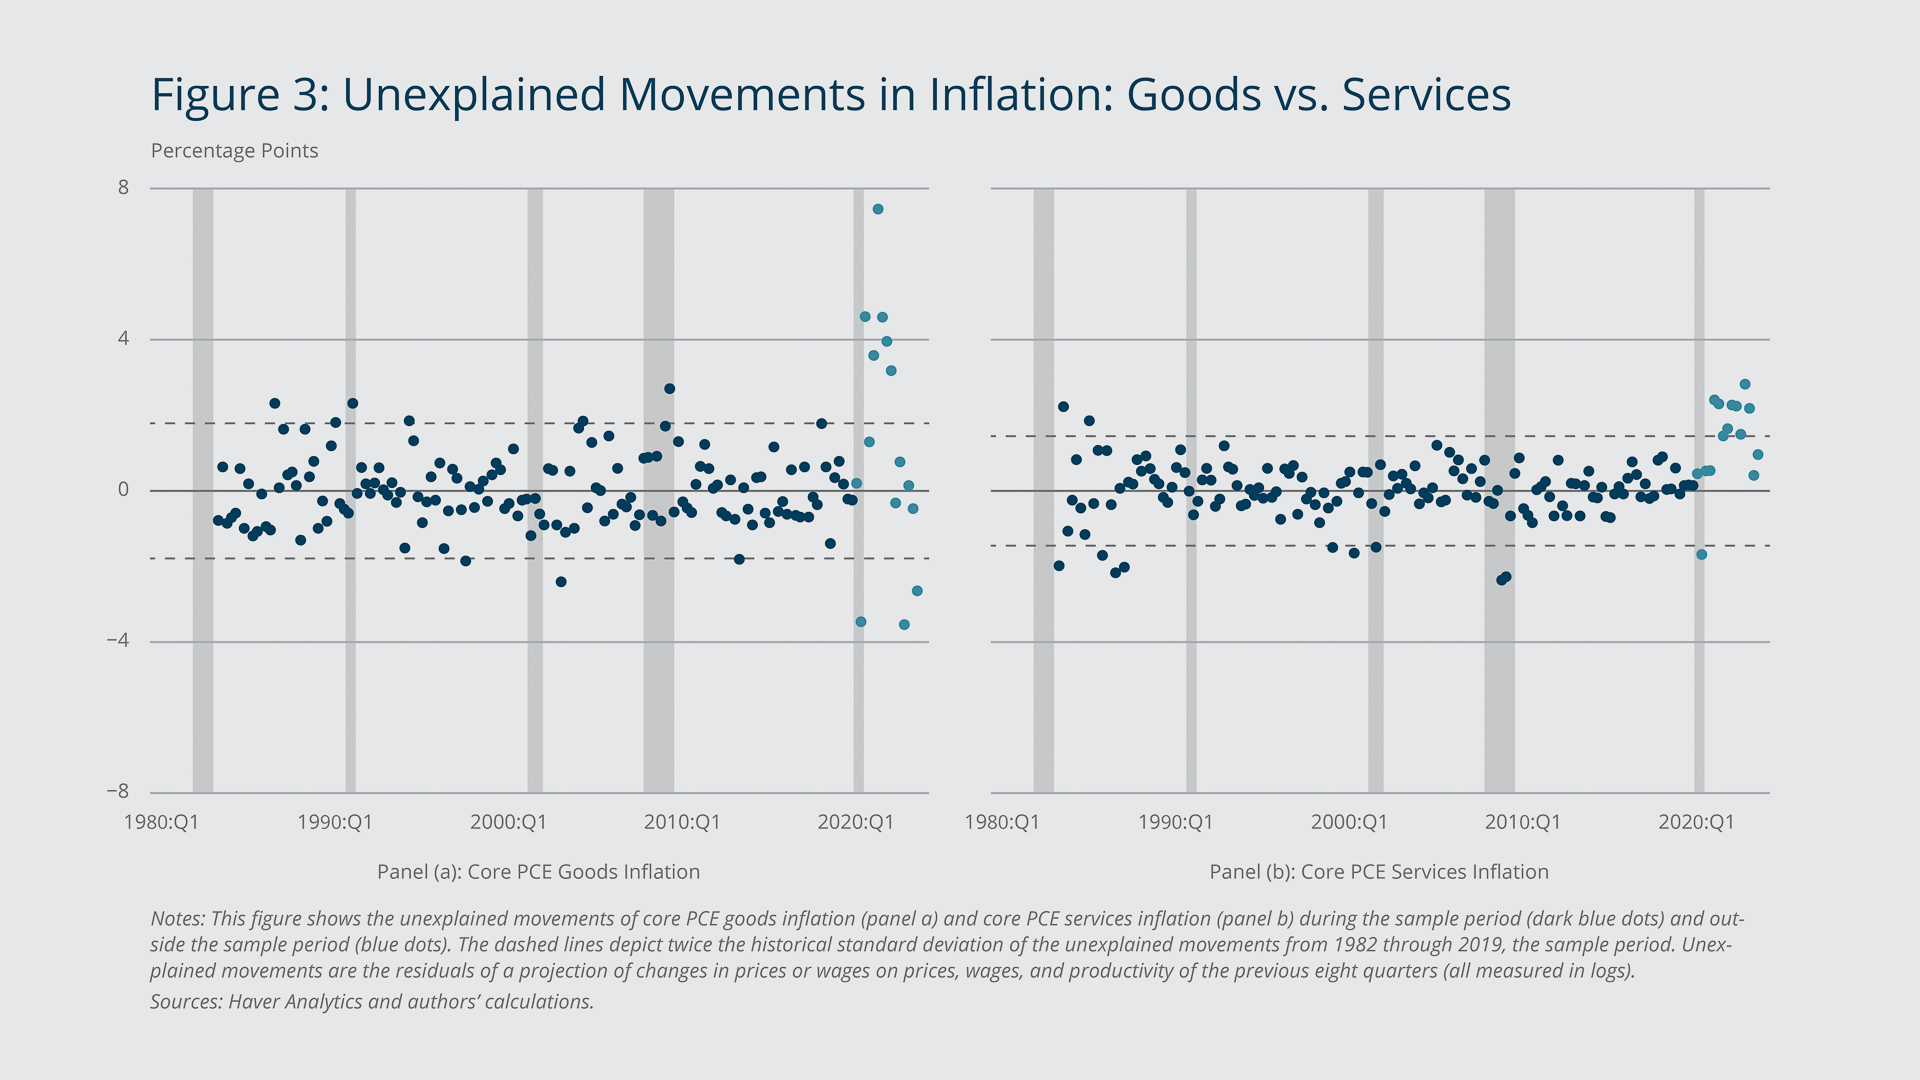
In Figure 3, we replicate our analysis for core PCE goods inflation (Panel a) and core PCE services inflation (Panel b) and find similar results. Early on in the pandemic, abnormal goods price shocks drove inflation; more recently (and to a lesser extent), abnormal service price shocks have been driving inflation. We find that in the second and third quarters of 2023, inflation dynamics were consistent with large disinflationary shocks in the goods sector and no significant inflationary shocks in services. Importantly, abnormal shocks are not needed to account for post-pandemic wage growth in either the service sector or goods sector. Wage growth has just followed the dynamics triggered by the initial shocks.
Federal Reserve Bank of Boston
Our empirical model implies that wage growth shocks accounted for less than 15 percent of inflation at the peak of the current inflationary episode, 2022:Q1, a result consistent with the findings of Blanchard and Bernanke (2023).6 To test whether this relatively small contribution of wage growth shocks to inflation is a mechanical feature of the data or our empirical method, we used the same method to analyze the 1970s inflation episode and found that, unlike with the recent inflation surge, wage growth shocks primarily drove inflation during that period.
How Fast Can Wages Grow without Adding Price Pressures?
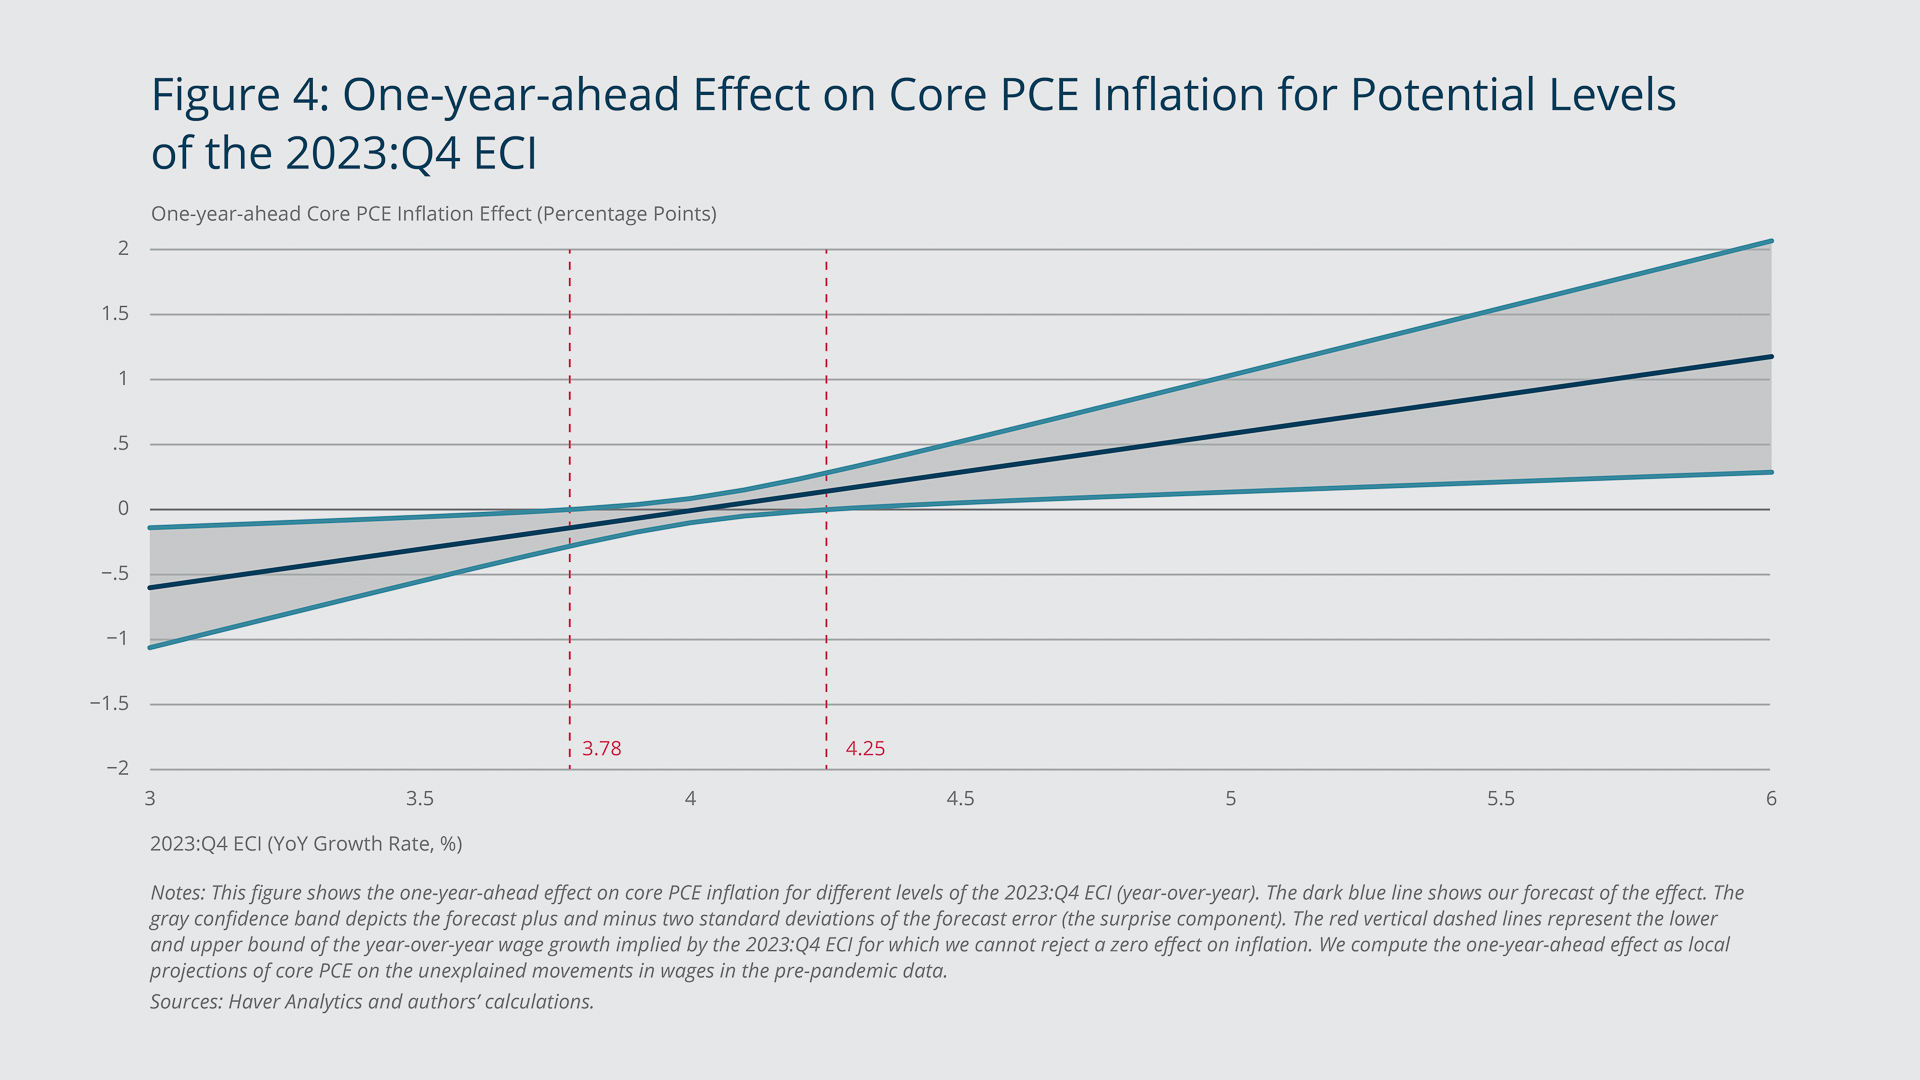
Our model estimates show that although wage growth has exceeded inflation in the last few quarters, it has not fueled additional inflation so far. This finding leads to the question of how much space wages have to catch up before they lead to additional inflationary pressures. To answer this question, we combine the findings from our model in the previous section with the projected effect of wage growth shocks on one-year-ahead core PCE and compute a forecast of the inflationary effect of hypothetical ECI growth for the fourth quarter of 2023.7
The results are shown in Figure 4. Our model forecasts no statistically significant additional pressures from wages on prices if year-over-year ECI growth in the fourth quarter lands within the dashed vertical lines, that is, 3.78 to 4.25 percent. Even for values slightly above this range but in line with recent realizations, our model predicts only a moderate effect of ECI growth on one-year-ahead inflation.8
Federal Reserve Bank of Boston
Note that our results imply there will be no additional impact on inflation dynamics from the labor market for a range of year-over-year ECI growth for 2023:Q4 that is clearly higher than the sum of the Federal Reserve’s inflation target of 2 percent and historic average productivity growth. The key economic force behind this result is the catch-up effect referred to above. Because inflation has, on average, grown faster than productivity-adjusted wages in the last three years, there is room for wage growth to surpass inflation for some time so that it aligns with the historic relationships among the growth rates of prices, wages, and productivity.
The views expressed herein are solely those of the authors and should not be reported as representing the views of the Federal Reserve Bank of Boston, the principals of the Board of Governors, or the Federal Reserve System.
Endnotes
- The Core Personal Consumption Expenditures (PCE) Price Index tracks prices of goods and services purchased by consumers in the United States, excluding food and energy costs. The ECI measures the change in the hourly labor cost to employers over time. The index uses a fixed “basket” of labor to produce a pure cost change that is not affected by workers moving between occupations and industries and includes both the cost of wages and salaries and the cost of benefits.
- The authors’ theoretical analysis highlights that following cost shocks (such as those induced by supply chain disruptions), real wages can increase or fall depending on various factors, such as the relative degree of price or wage rigidities. The direction and dynamics of real wages are not indicative of the existence of a wage-price spiral or how powerful a spiral is. In the authors’ model, following a cost shock in an input price, inflation is higher than wage growth early on, but eventually wage growth surpasses inflation, and real wages start rising again, as observed in the data. This real wage growth in the later periods does not fuel more inflation; rather, it is a delayed response of wages relative to prices to the original shock in the economy.
- More specifically, we model changes in both log core PCE and log ECI as a linear function on eight lags of log core PCE, log ECI, and log productivity. Importantly, such lag-augmented levels models are robust to co-integrating relationships among the variables in our models (Kilian and Lutkepohl 2017). Figures 2 and 3 then plot the inflation and wage residuals from these models.
- Our results are robust to using alternative measures of prices (for example, the Consumer Price Index and core PCE excluding housing), of wages (average hourly earnings), or productivity (real output per hour worked). Our results are also robust to using alternative estimation periods. In addition, we find similar results when we estimate the model using only data from the 1982:Q1–2009:Q4 period and then project forward the implied residuals for the 2010s and the 2020–2023 period, which addresses concerns about parameter stability and mechanical in-sample goodness of fit.
- Abnormal shocks were those that manifested in residuals larger than two standard deviations of the residuals observed over the estimation period.
- When they wrote their article in late 2022, the authors were emphasizing the risk of abnormal wage increases induced by a tight labor market, in particular a large number of vacancies per unemployed, leading to additional price pressures. Our estimation shows that this risk did not materialize.
- We do so by using lag-augmented local projections (Jordà 2005; Montiel Olea and Plagborg-Møller 2021), a method widely employed in empirical macroeconomics research. We regress the log price changes on unexplained movements in wage growth using pre-pandemic data. Given the estimated model, we then use the implied unexplained component of ECI growth for 2023:Q4 (the hypothetical realization) to compute its one-year-ahead effect.
- This is consistent with the evidence in Barlevy and Hu (2023) and Shapiro (2023), which show that usual shocks to productivity-adjusted labor costs have little impact on inflation.
References
Barlevy, Gadi, and Luojia Hu. 2023. “Unit Labor Costs and Inflation in the Non-housing Service Sector.” Chicago Fed Letter No. 477.
Blanchard, Olivier J., and Ben S. Bernanke. 2023. “What Caused the US Pandemic-era Inflation?” National Bureau of Economic Research Working Paper 31417.
Jordà, Òscar. 2005. “Estimation and Inference of Impulse Responses by Local Projections.” American Economic Review 95(1): 161–182.
Kilian, Lutz, and Helmut Lütkepohl. 2017. Structural Vector Autoregressive Analysis. Cambridge, England: Cambridge University Press.
Lorenzoni, Guido, and Iván Werning. 2023. “Wage-price Spirals.” Brookings Papers on Economic Activity Fall.
Montiel, José Luis Montiel, and Mikkel Plagborg-Møller. 2021. “Local Projection Inference Is Simpler and More Robust Than You Think.” Econometrica 89(4): 1789–1823.
Shapiro, Adam Hale. 2023. “How Much Do Labor Costs Drive Inflation?” FRBSF Economic Letter. 2023-13.

 About the Authors
Philippe Andrade,
Federal Reserve Bank of Boston
Email: Philippe.Andrade@bos.frb.org
Falk Bräuning,
Federal Reserve Bank of Boston
Email: falk.brauning@bos.frb.org
José L. Fillat,
Federal Reserve Bank of Boston
Email: Jose.Fillat@bos.frb.org
Gustavo Joaquim
Acknowledgments
The authors thank Philippe Andrade and Jenny Tang for very helpful comments and John O’Shea for excellent research assistance.
Resources
Site Topics
JEL Codes
- E24 ,
- E31
Citation
Andrade, Philippe, Falk Bräuning, José L. Fillat, and Gustavo Joaquim. 2024. “Is Post-pandemic Wage Growth Fueling Inflation?” Federal Reserve Bank of Boston Current Policy Perspectives 24-1.
Related Content
Household Inflation Expectations and Consumer Spending: Evidence from Panel Data
The Local Aggregate Effects of Minimum Wage Increases
Oil and the Macroeconomy in a Changing World: A Conference Summary
Public Cost of Low-Wage Work in New England