Yale Labor Survey - Report of December 15, 2020 for the week ending December 5, 2020 

Meghan Smith/Federal Reserve Bank of Boston


The Yale Labor Survey, a research project from Yale University’s Tobin Center for Economic Policy, is designed to provide policy makers and the public with real-time information about the US labor market. Its questions are modelled on those of the monthly BLS-Census Current Population Survey. The project has been designed and developed by researchers at Yale University, Stanford University, and the Boston Fed’s research department. Data are made available weekly at the websites of the Boston Fed and the Yale Labor Survey website at the Tobin Center. Background documentation for the Yale Labor Survey is available in Cowles Foundation Discussion Paper No. 2243. The Yale Labor Survey is not an official forecast of the Federal Reserve Bank of Boston or its president, the Federal Reserve System, or the Federal Open Market Committee.
Results Summary
YLS data collection has resumed after a short hiatus, and survey results for weeks ending November 14, November 21, November 28, and December 5 are reported below. YLS surveys were not conducted during the three weeks prior to November 14. As described below, with this report the YLS introduces a new system of survey weights, which bring the YLS into closer agreement with data from the government’s Current Population Survey (CPS). YLS data are not seasonally adjusted and refer to the population aged 20 and older. This week’s key findings are as follows:
- YLS employment measures have risen modestly since the week of November 14, the reference week of the most recent CPS. For the week ending December 5, the YLS estimate of persons at work as a share of population (the work-for-pay ratio) was 0.3 percentage point higher than during the week ending November 14. The employment-to-population ratio, which also includes persons temporarily absent from work, rose 0.6 percentage point over the same period.
- The YLS estimate of the unemployment rose significantly from mid-October to mid-November, although this movement was not found in the CPS (where the unemployment rate fell modestly). The proximate cause of this discrepancy is a higher share of YLS respondents who are looking for work, as non-employed persons who are conducting active job searches are counted as unemployed in labor market surveys.
A Note on New Sample Weights
- All of the data generated below use a new system of YLS sample weights, which balance the YLS sample with respect to the demographic structure of the US population. As described in the background documentation, a novel feature of the YLS is that its sample weights also balance the sample with respect to the labor force attachment of the population. This balance is achieved using data about YLS respondents’ previous labor market statuses (that is, employment, unemployment, and participation) and official US data for those months.
- Before the hiatus, this balance was based on February labor market status. As a result, the (weighted) February labor force statuses of YLS respondents in every YLS week matched the official percentages of persons employed, unemployed, and out-of-the-labor force from the February CPS.
- As time progressed, the February-based weights did less well in bringing YLS estimates of employment, unemployment, and participation into line with CPS results. Accordingly, the new system of sample weights updates the months used for weight-construction on a rolling basis. For example, in the new system the weights used for the week of December 5 are an average of weights based on October labor market status and a separate set of weights based on November labor market status. In January, YLS results will be based on an average of weights based on November and December data. Details of the new weighting procedure are available in the accompanying Variable and Weight Description available on this website.
- The new weighting system restores the close agreement between YLS and CPS measures of working-for-pay and employment. Yet the new strategy still generates in sizeable gaps in rates of unemployment and participation. These gaps remain an active area of research for the YLS team.
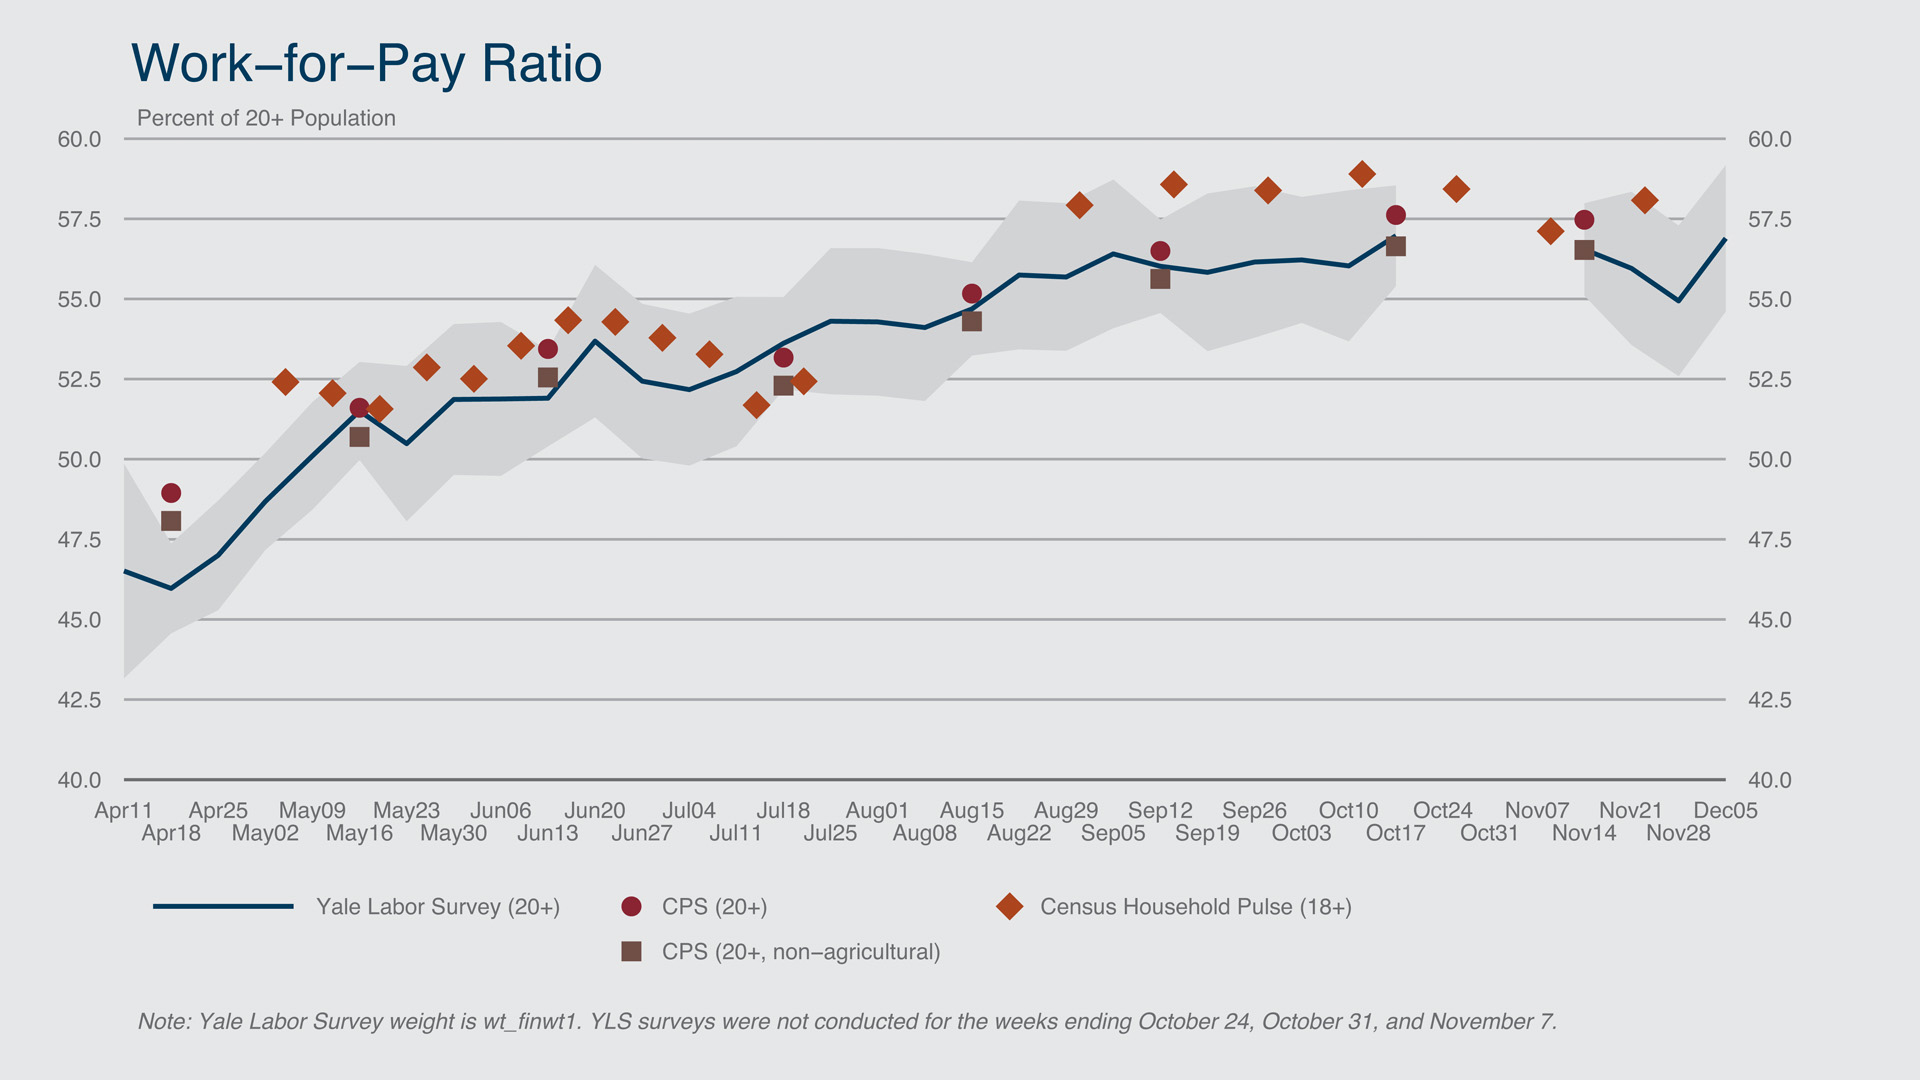
Work-for-Pay Ratio
The work-for-pay ratio (WFPR) measures the fraction of survey respondents who report that they worked for pay or profit during the reference week. This rate fell in late November—perhaps because of the Thanksgiving holiday—but has since recovered. For the week ending December 5, the WFPR stood at 56.9%, 0.3 percentage point higher than during mid-November.
Federal Reserve Bank of Boston
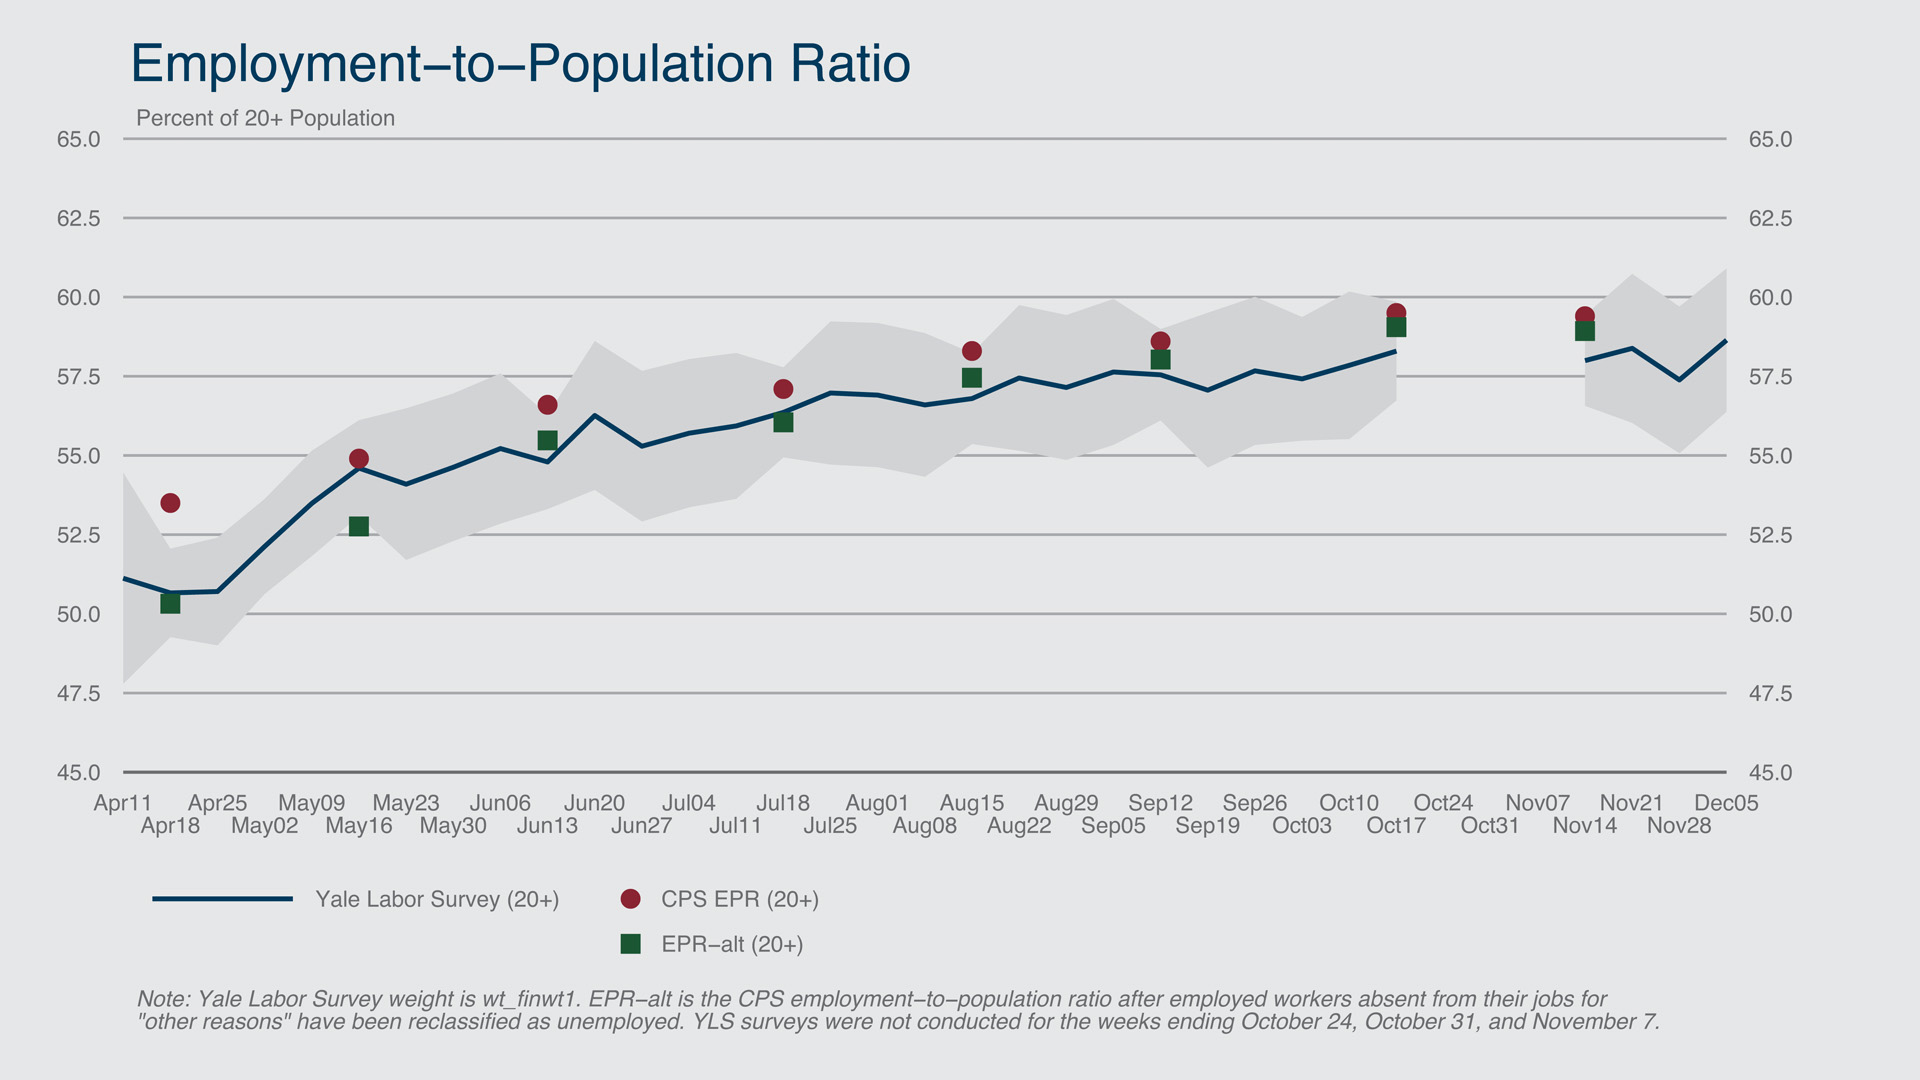
Employment-to-Population Ratio
The employment-to-population ratio (EPR) is the standard measure of labor market activity reported by the Bureau of Labor Statistics (BLS). In addition to persons working for pay, the EPR also includes workers who are absent from their regular jobs (for example, workers on vacation). Like the WFPR, the EPR also dipped in late November but has since rebounded. The EPR stood at 58.6% for the week ending December 5, 0.6 percentage point higher than during mid-November.
During the pandemic, the BLS has stated that the CPS has had difficulty distinguishing between workers who were absent from their jobs for the usual reasons (such as vacation or illness) and workers who were displaced by the pandemic. An alternative measure of the government’s EPR calculated by YLS researchers with CPS microdata, “EPR-alt,” is designed to remove pandemic-displaced workers from CPS employment. The EPR-alt measure is close to the YLS definition of employment, which includes only paid absences and is therefore less susceptible to classification error (see the background documentation for details). The most recent CPS estimate for EPR-alt corresponds to the week ending November 14, when this statistic was 58.9%, down slightly from its 59.1% reading from mid-October.
Federal Reserve Bank of Boston
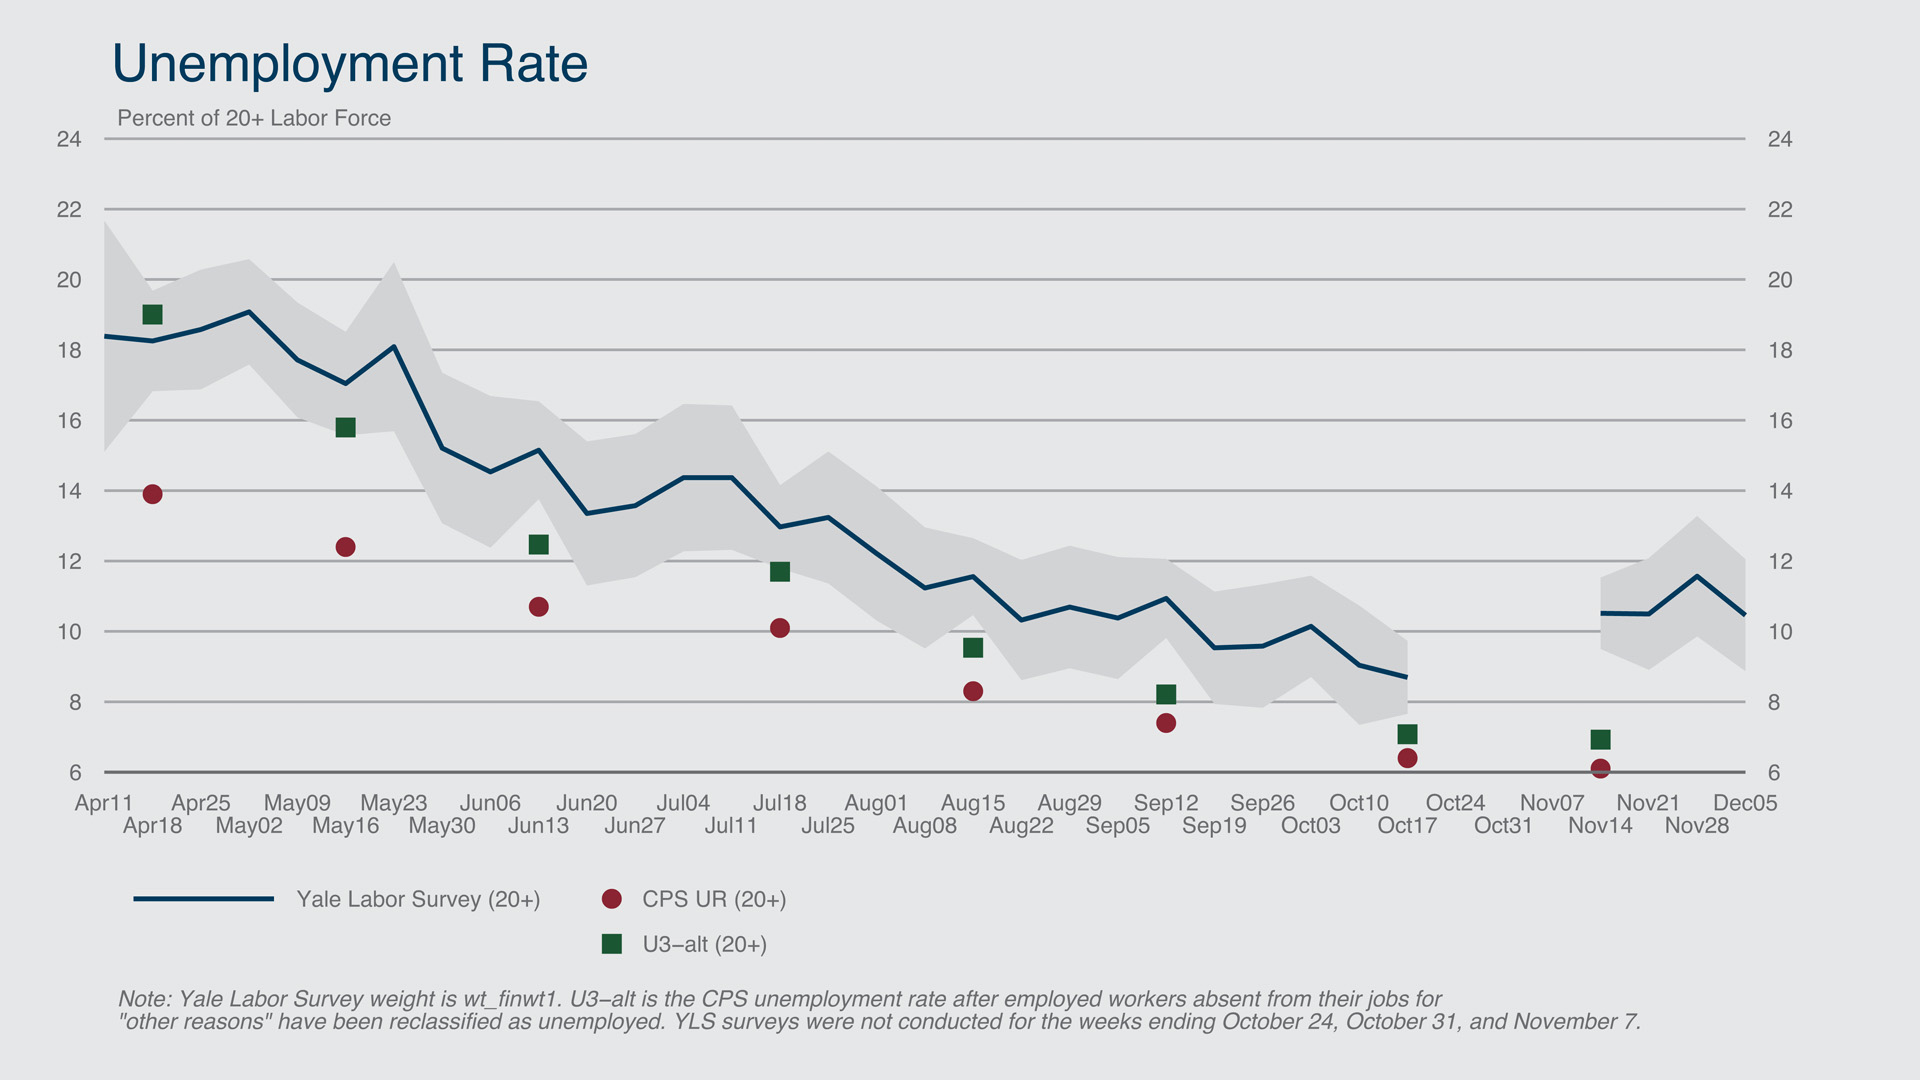
Unemployment Rate
The YLS has consistently overestimated the unemployment rate, although the divergence depends upon whether corrections for recent CPS classification errors discussed above are made. To be classified as unemployed, a non-employed person must either (i) have actively searched for a job in the last four weeks, or (ii) be laid off from a job with an expectation of return. The questions that gather information about job-search activities and layoff conditions differ slightly between the CPS and YLS.
As noted above, the unemployment-rate discrepancy has grown in recent weeks. The YLS unemployment rate stood at 10.5% during the November CPS reference week, compared to a CPS 20+ rate of 6.1%. After rising in late November, the YLS rate fell back to 10.5% in the week ending December 5.
Federal Reserve Bank of Boston
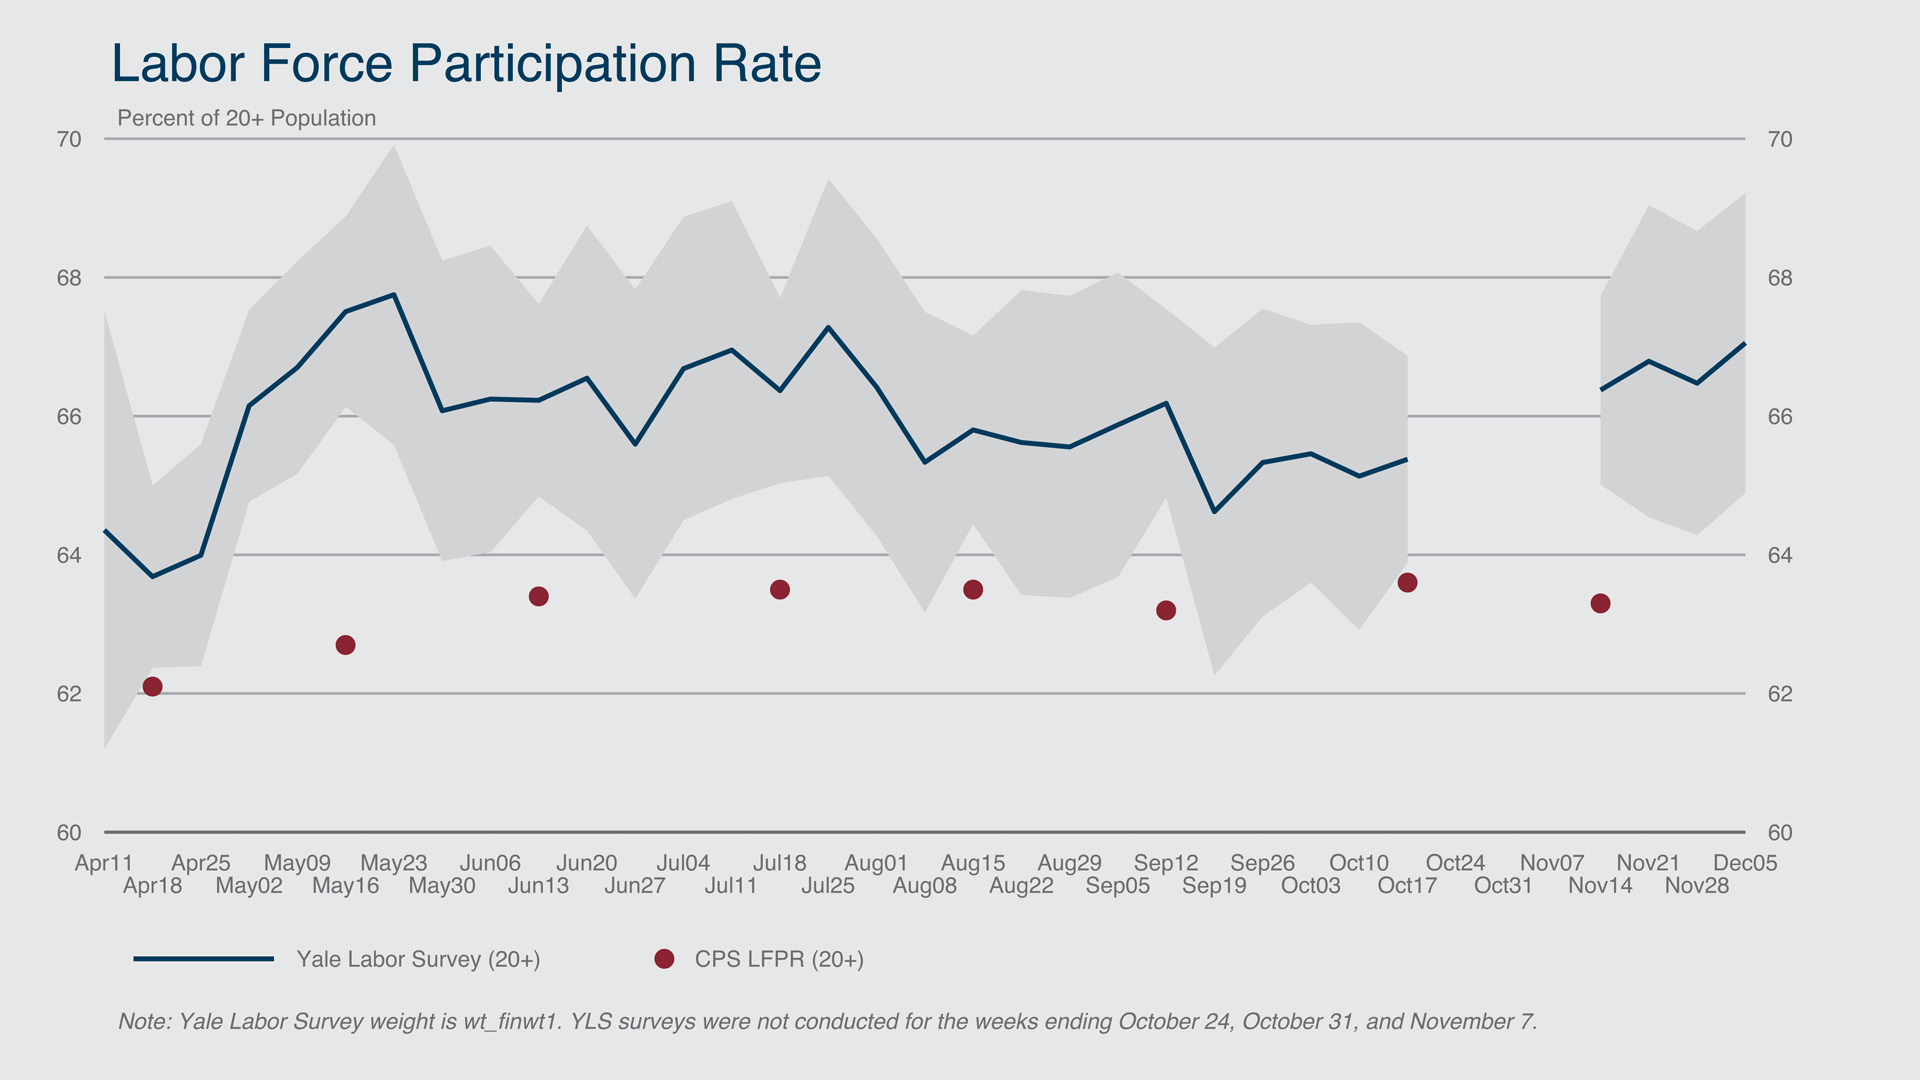
Labor Force Participation Rate
As of the week ending December 5, the YLS labor force participation rate (LFPR) stood at 67.1%, up 0.7 percentage point from its mid-November value. The corresponding mid-November reading from the CPS was 63.3%. Because employment readings in the YLS are close to those from the CPS, the gap of nearly 4 percentage points between the YLS and CPS participation rates explains most of the gap between CPS and YLS unemployment rates.
Federal Reserve Bank of Boston
 collapse all
 expand all
Site Topics
Related Content
Yale Labor Survey - Report of December 23, 2020 for the week ending December 12, 2020
Yale Labor Survey - Report of January 5, 2021 for the week ending December 26, 2020
Yale Labor Survey - Report of August 18, 2020 for the week ending August 8, 2020
Yale Labor Survey - Report of September 15, 2020 for the week ending September 5, 2020