The Impact of Tariffs on Inflation 


Federal Reserve Bank of Boston
The views expressed herein are solely those of the authors and should not be reported as representing the views of the Federal Reserve Bank of Boston, the principals of the Board of Governors, or the Federal Reserve System.
Assessing how import prices affect US consumers requires looking beyond direct consumer purchases of imported products. Most goods that bear a “Made in the USA” label contain imported components, and when these components become more expensive, the final consumer good will likely also become more expensive. Moreover, most producers and retailers charge a large markup on top of costs. It is therefore important to take into account how these markups respond to cost changes of imported components.
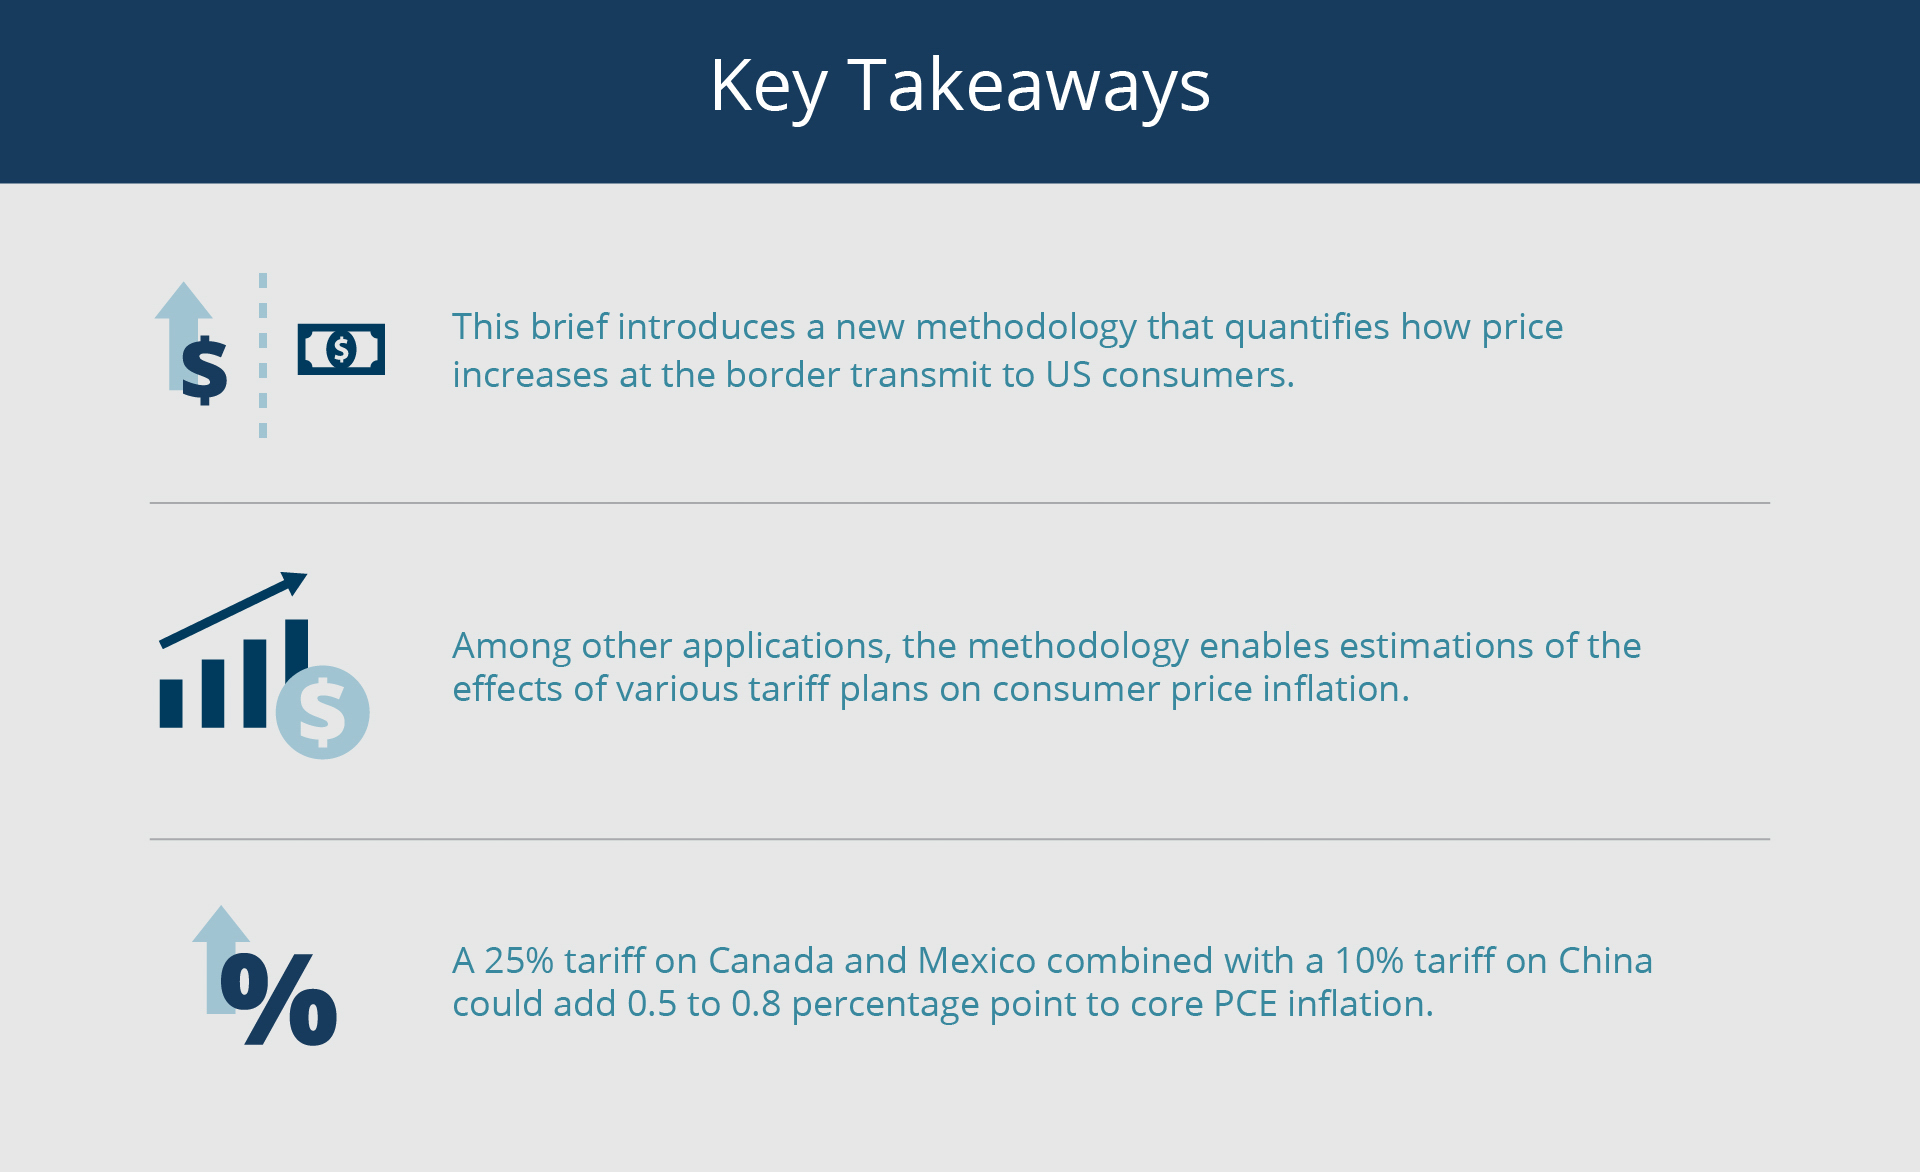
Motivated by these insights, we have developed a new methodology that quantifies how price increases at the border transmit to US consumers. Our methodology allows us to determine the share of US consumption that would be subject to such increases and to break them down into different country and industry sources. Among other applications, our methodology enables us to compute the effects of various tariff plans on consumer price inflation, as tariffs effectively increase the border prices of imported goods.
Sign up for Research Department Updates.
For example, we estimate that an additional 25 percent tariff on goods from Canada and Mexico combined with an additional 10 percent tariff on goods from China could add as much as 0.8 percentage point to core (excluding food and energy) inflation. By contrast, the policy that was proposed during the presidential campaign, an additional 60 percent tariff on imports from China and an additional 10 percent tariff on imports from the rest of the world, could have contributed as much as an additional 2.2 percentage points to core inflation.1 It is important to emphasize that our estimates represent a first-round effect on prices. That is, they do not take into account how consumers and competitors eventually might adjust to the import price increases that tariffs induce.
Spending on Indirect Imports Can Be Substantial
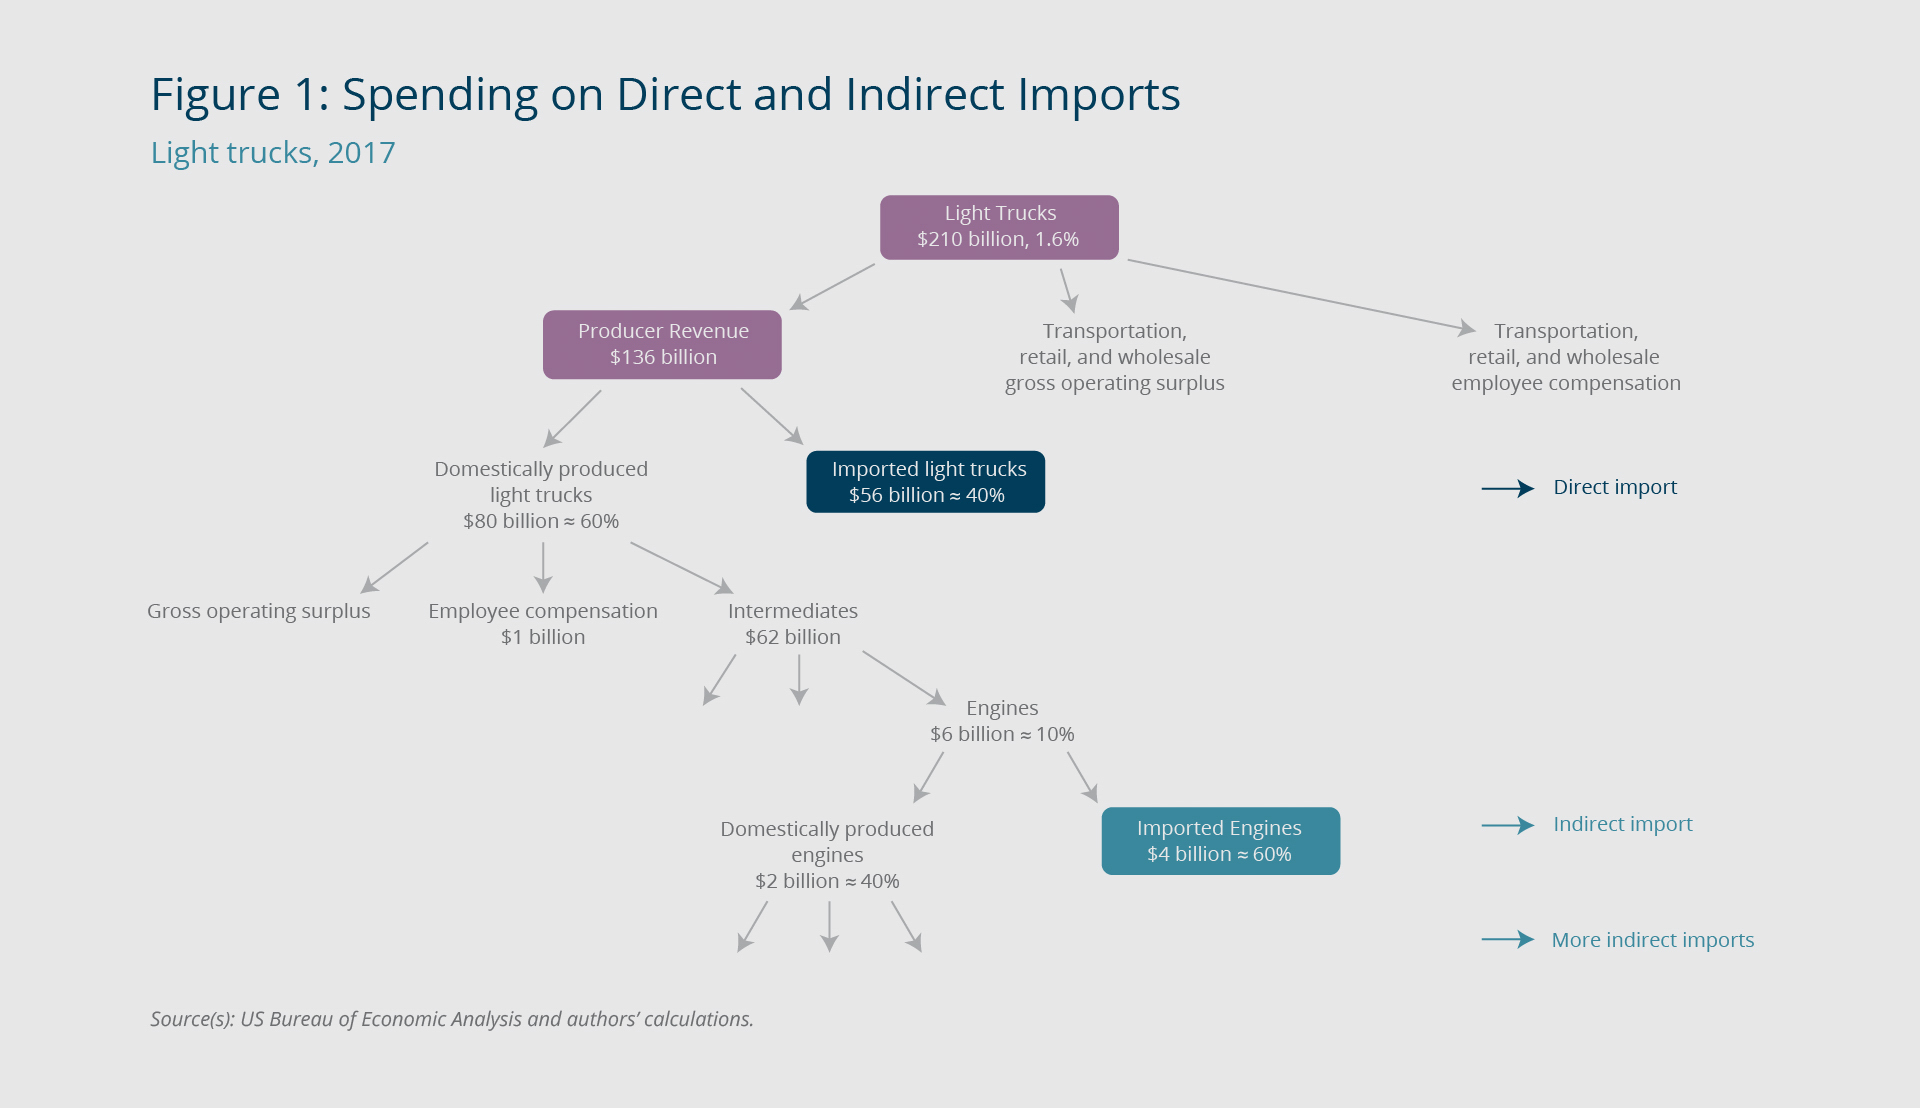
Figure 1 presents light trucks as an example that illustrates the two concepts behind our methodology—that domestically produced goods contain imported components and that import prices can be reflected in markups at every stage of production. The light trucks category includes vans, pickups, and SUVs. According to Personal Consumption Expenditure (PCE) data, spending on new light trucks accounts for about 1.6 percent of American households’ total consumption. Put differently, US households spent more than $210 billion on new light trucks in 2017.2 The producers of these light trucks received about 65 percent of this $210 billion, or about $136 billion. The rest went toward the transportation, retail, and wholesale sectors. Of the $136 billion from US households that went to producers, about 60 percent (or $80 billion) was spent on domestically built trucks and about 40 percent (or $56 billion) on foreign-built (imported) trucks.3 Therefore, we can say that US households spent $56 billion on direct imports of new light trucks.
Federal Reserve Bank of Boston
However, households that buy American-made trucks are not immune from fluctuations in import prices. This becomes apparent when we further break down domestic light truck expenditure into gross operating surplus, compensation of employees, and cost of intermediate goods.4 For example, engines constitute $6 billion of US light truck producers’ cost of materials, and 40 percent of these engines are imported. In turn, domestically produced engines contain imported parts. Our methodology enables us to compute that overall, $20 billion from US households is spent on indirect imports within the light truck category, over and above the $56 billion spent directly on imported light trucks.5
Our methodology generalizes the logic of the light truck example to capture the entire imported content of US consumption. It uses input-output tables and PCE bridge tables from the US Bureau of Economic Analysis (BEA) that detail the supply-chain relationship between 402 commodity-by-industry categories in the United States as well as each industry's gross operating profits and compensation of employees. The Appendix provides a detailed description of our methodology, which borrows from Baqaee and Rubbo (2023) and Silva (2024). To the best of our knowledge, our approach is the first to account for the magnitude of retail markups in its calculations and to consider a plausible range of assumptions about how markups will respond to import price changes.6
Imports Account for an Estimated 10 Percent of Core PCE
Overall, we estimate that 6 percent of core PCE is directly imported, and 4 percent is indirectly imported; that is, spending on direct and indirect imports accounts for 10 percent of total US household consumption, excluding spending on food and energy.7
These shares have been consistent over the past two decades. Our methodological framework enables us to break down these shares into underlying input commodities (the raw materials used to manufacture products) or expenditure categories. Figure 2 shows the contribution of both direct and indirect imports to core PCE, broken down by expenditure category. (We use the national income and product accounts [NIPA] categories of goods and services.) For example, direct imports of pharmaceutical and other medical products account for 0.7 percent of core PCE. Spending on indirect imports used in the domestic production of pharmaceutical and other medical products comprises 0.2 percent of core PCE. Total imports—the sum of the direct and indirect components—in the pharmaceutical and other medical products sector account for 0.9 percent of core PCE. The chart also highlights that some expenditure categories, such as hospital and nursing home services, may use a lot of indirect imports, though those services tend to be domestically produced.
Federal Reserve Bank of Boston
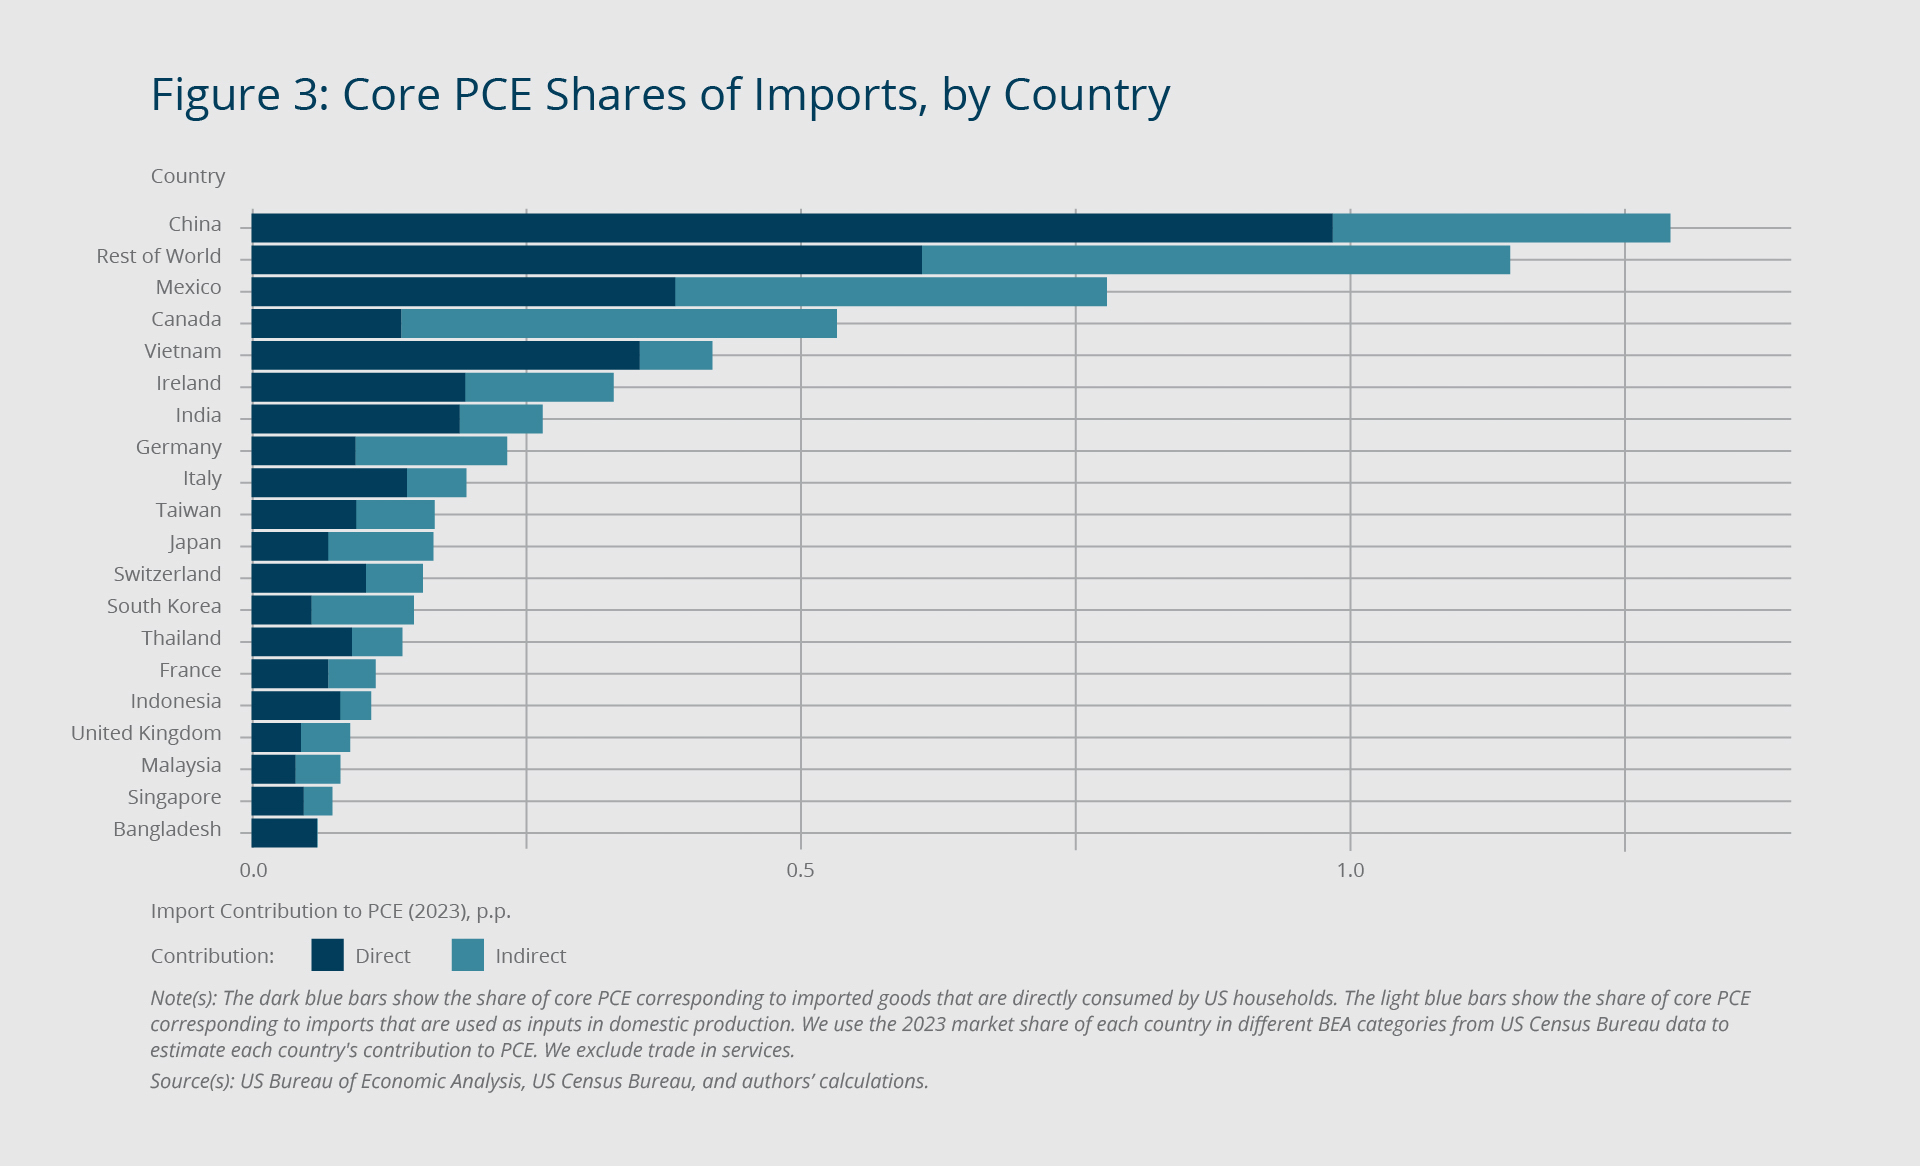
Our granular approach also enables us to delve into the source countries of these direct and indirect imports. We do so using the share of each product that comes from different countries, according to US Census Bureau data. In Figure 3, each bar depicts the PCE share of direct or indirect imports coming from a given country. It shows that China provides more direct imports than indirect imports to core PCE. Specifically, 1 percent of core PCE consists of direct imports from China, whereas 0.3 percent consists of indirect imports from China. Mexico and Canada, on the other hand, provide larger shares of indirect imports to core PCE. Mexico provides 0.4 percent of core PCE through direct imports and 0.4 percent through indirect imports, while Canada provides 0.1 percent of core PCE through direct imports and 0.4 percent through indirect imports.
Federal Reserve Bank of Boston
Response of Prices to Tariffs Depends on How Markups Respond
As noted, our methodology has multiple applications. Here, we use our detailed breakdown of PCE into imported components to estimate the impact of tariffs on core PCE inflation. Our estimates assume that the full burden of the tariffs is paid by US importers, consistent with what was observed with the tariff increases that were imposed in 2018 (Fajgelbaum et al. 2019; Amiti, Redding, and Weinstein, 2019; Cavallo et al. 2021). First, we assess the potential impact of an additional 25 percent tariff on Canada and Mexico and an additional 10 percent tariff on all imports from China. The tariffs on goods from Canada and Mexico were set to go into effect on February 4, 2025, but were postponed for at least 30 days and were on hold when this brief was published. The tariff on goods from China went into effect on February 4.8
Second, we assess the impact of an additional 60 percent tariff on imports from China and an additional 10 percent tariff on imports from the rest of the world, a policy that was proposed during the presidential campaign. We estimate that, depending on the response of markups, the new tariffs could add a minimum of 0.5 percentage point to core PCE inflation and the earlier proposal could have added a maximum of 2.2 percentage points, keeping all else in the economy constant.
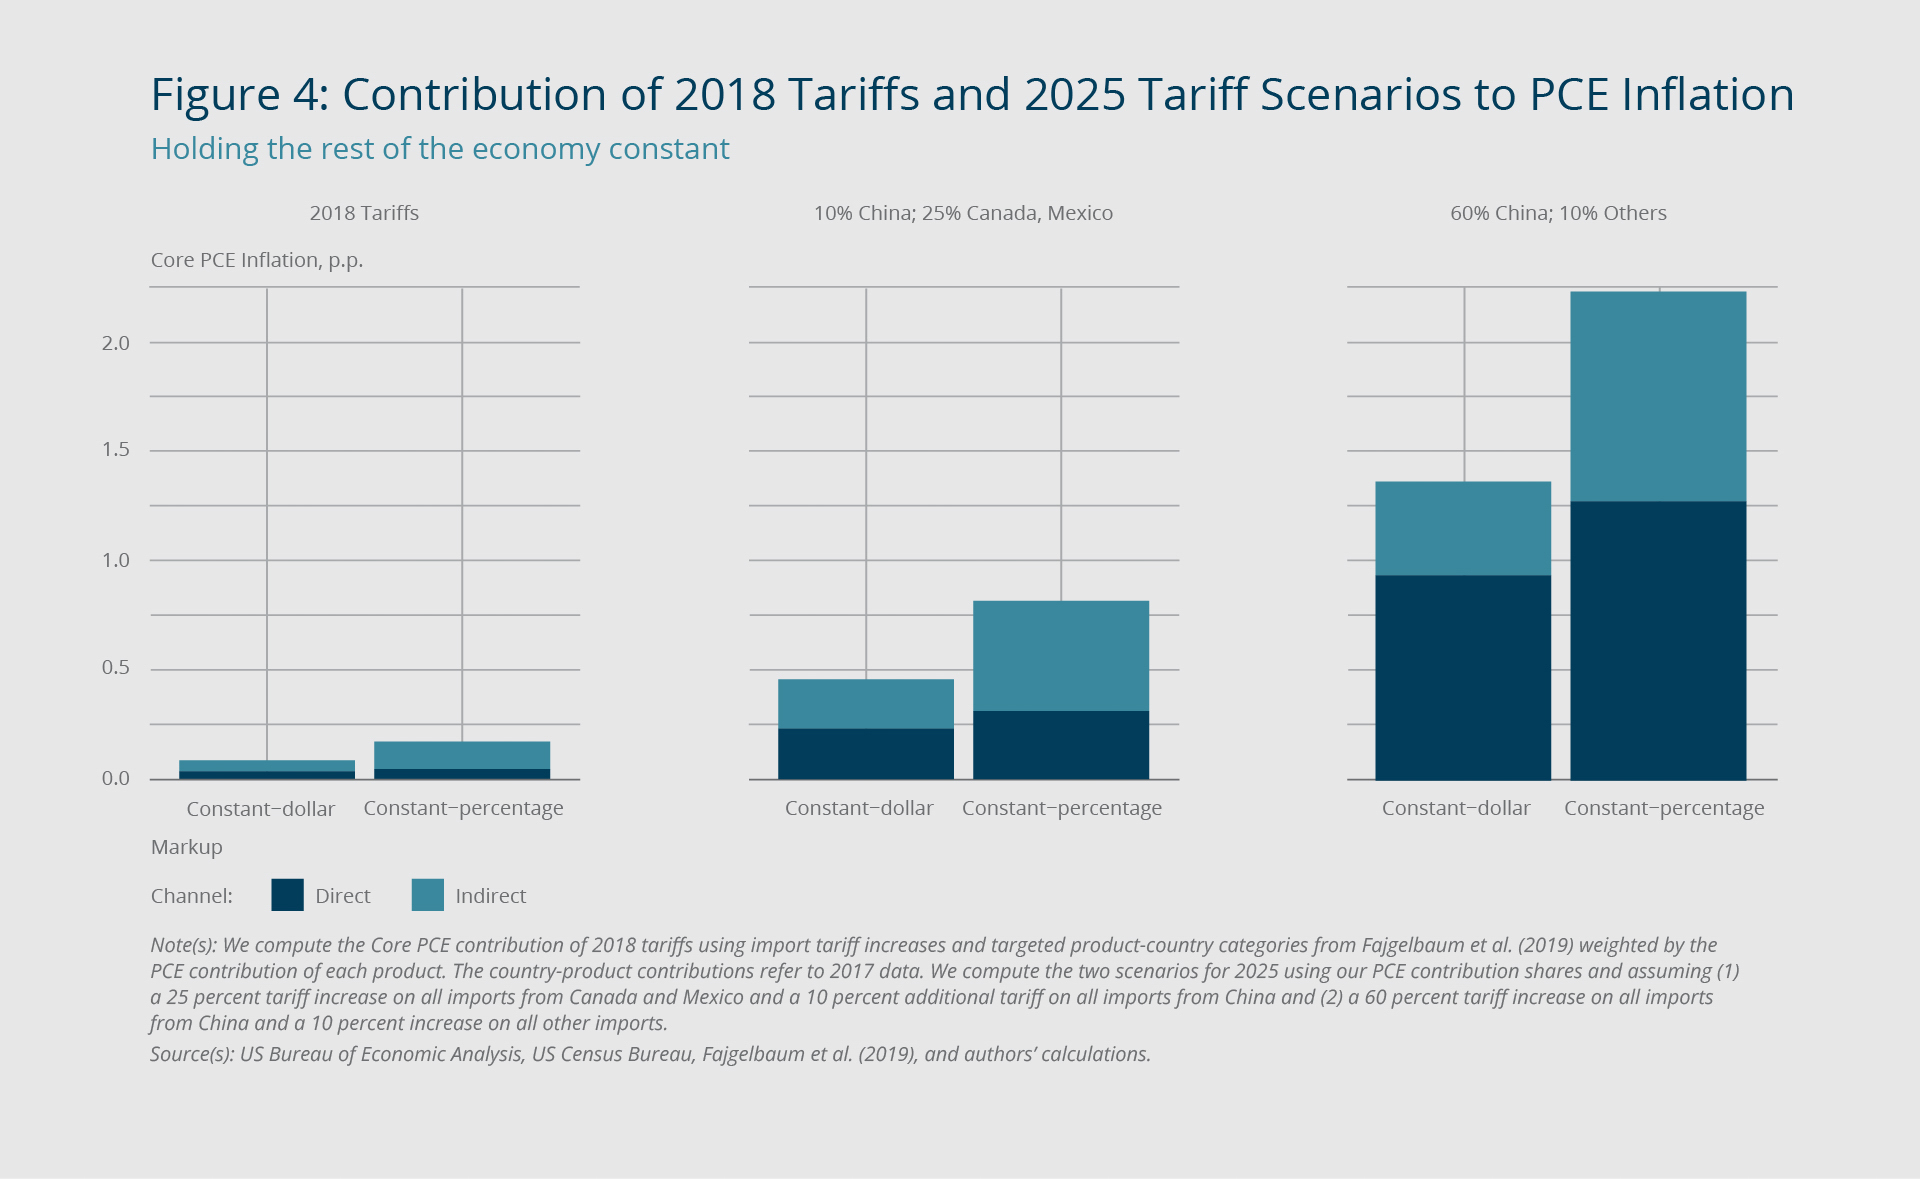
The response of consumer prices to tariffs depends crucially on how markups respond. For example, consider the purchase of a hypothetical foreign good. The domestic retail store buys the foreign good for $1 and sells it to its customers for $2. (In this example we assume the retailer has no costs.) This means that half of the final expenditure is imported, and half is a domestic profit that goes to the retailer. If the cost of the imported good increases 10 percent (to $1.10), and if the domestic profit stays constant in dollar terms (that is, it remains $1), then the price of the consumer good will increase 5 percent to $2.10 (that is, the price of the consumer good increases in percentage terms by only half of the import price increase). We call this the “constant-dollar” markup assumption.9
Alternatively, if the retailer wants to maintain its markup at 100 percent on top of the cost of materials, then the price of the consumer good will increase to $2.20, a 10 percent increase (that is, the price of the consumer good increases in percentage terms by an amount equivalent to the import price increase).10 We call this the “constant-percentage” markup assumption. Our constant-dollar assumption provides a lower bound to our estimates, whereas the constant-percentage assumption provides an upper bound.
Figure 4 shows our estimates of how tariff changes will affect core PCE inflation. We estimate that the 2018 tariffs accounted for 0.1 to 0.2 percentage point of core PCE inflation (holding the rest of the economy constant). We are not aware of any studies that estimate the aggregate partial equilibrium effects (that is, all else being equal) of the 2018 tariffs on core PCE. However, a back-of-the-envelope calculation from Fajgelbaum et al. (2019) shows that the overall tariff increase accounted for at most 0.3 percentage point of core PCE inflation.11
Federal Reserve Bank of Boston
Turning to the 25 percent tariff on Canada and Mexico and 10 percent on China, we estimate an inflation impact of 0.5 to 0.8 percentage point, depending on the markup assumption. Under the more extreme scenario of a 60 percent tariff on China and a 10 percent tariff on the rest of the world, we estimate an inflation impact of 1.4 to 2.2 percentage points.12
As noted, our estimates give the first-round impact of tariffs on inflation, holding quantities constant (that is, we calculate the effects under partial equilibrium). In other words, we assume that demand will remain constant despite the price changes and that consumers will not substitute to different products or similar products from different countries. We also assume that wages, non-tariff taxes and subsidies, and productivity will stay constant. Overall, we would expect general equilibrium effects, including those related to retaliatory actions, domestic and foreign monetary policy, and exchange rates to dampen our inflation estimates due to their suppressive effect on economic growth.
Endnotes
- In this brief, we measure inflation with Personal Consumption Expenditure (PCE) inflation, the Federal Reserve’s preferred inflation index.
- For the example presented in Figure 1, we use numbers from 2017 due to the finer details available for that year.
- Official PCE data break down consumption on domestic new light trucks and foreign new light trucks; however, they include trucks made in Mexico and Canada in the domestic category. New light trucks and new autos are the only goods for which the PCE data break down consumption in this way; the data do not include information on the imported composition of any other goods.
- Gross operating surplus includes consumption of fixed capital (CFC), proprietors’ income, corporate profits, and business current transfer payments. For simplicity, our estimates assume that gross operating surplus is equivalent to markups, and we use the two terms interchangeably.
- Note that these imports may include parts that were made in the United States; however, because tariffs tend to be applied on the entire value of the good at the border rather than on only the foreign value added, we do not subtract the value of American-made components of imported products.
- This methodology is an important improvement compared with, for example, using the imported share of goods from Census Foreign Trade data. Official import data are expressed in producer prices and include imports that are not necessarily used for final consumption; they may include imports that are used for exports, government expenditure, or investments.
- Our calculation of the import contribution to PCE is similar but not equivalent to that of Hale et al. (2019), who estimate that 11 percent of headline PCE (PCE including food and energy) can be traced to imported goods.
- The original policy announcement stated that energy resources from Canada would be subject to a 10 percent tariff, though this reprieve may have been temporary, and the relevant Harmonized Tariff Schedule of the United States (HTSUS) codes were not released. In this brief, we analyze the impact of a 25 percent tariff on all goods from Canada, including energy resources.
- We computed the core PCE shares in the preceding section using this constant-dollar assumption. If we use the alternative assumption, we find that an 8 percent share of core PCE is directly imported, and a 9 percent share is indirectly imported; that is, spending on direct and indirect imports accounts for 17 percent of total US household consumption, excluding spending on food and energy.
- In our calculations, we always assume that employee compensation remains constant in dollar terms.
- Using the summary statistics from Table 1 of Fajgelbaum et al. (2019): $302,970 million of targeted imports multiplied by a weighted tariff increase of 14 percent over $11,730 billion of 2017 core PCE is equivalent to a 3.6 percentage point effect, which is slightly higher than our estimates because it includes imports not used for final consumption, which we exclude.
- Note that this is a total effect without dynamics; our current analysis does not allow for an estimate of the time period over which we might see this outcome.
References
Amiti, Mary, Stephen J. Redding, and David E. Weinstein. 2019. “The Impact of the 2018 Tariffs on Prices and Welfare.” Journal of Economic Perspectives 33(4): 187–210. https://doi.org/10.1257/jep.33.4.187
Baqaee, David, and Elisa Rubbo. 2023. “Micro Propagation and Macro Aggregation.” Annual Review of Economics 15: 91–123. https://doi.org/10.1146/annurev-economics-082322-012833
Cavallo, Alberto, Gita Gopinath, Brent Neiman, and Jenny Tang. 2021. “Tariff Pass-through at the Border and at the Store: Evidence from US Trade Policy.” American Economic Review: Insights 3(1): 19–34. https://doi.org/10.1257/aeri.20190536
Fajgelbaum, Pablo D., Pinelopi K Goldberg, Patrick J Kennedy, and Amit K Khandelwal. 2019. “The Return to Protectionism.” The Quarterly Journal of Economics 135(1): 1–55. https://doi.org/10.1093/qje/qjz036
Hale, Galina, Bart Hobijn, Fernanda Nechio, and Doris Wilson. 2019. “How Much Do We Spend on Imports?” FRBSF Economic Letter 2019-01.
Silva, Alvaro. 2024. “Inflation in Disaggregated Small Open Economies.” Federal Reserve Bank of Boston Research Department Working Papers No. 24-12. https://doi.org/10.29412/res.wp.2024.12

 About the Authors
Omar Barbiero,
Federal Reserve Bank of Boston
Omar Barbiero is an economist in the Federal Reserve Bank of Boston Research Department.
Email: Omar.Barbiero@bos.frb.org
Hillary Stein,
Federal Reserve Bank of Boston
Email: hillary.stein@bos.frb.org
Acknowledgments
The authors thank Philippe Andrade and Alvaro Silva for their constructive feedback. Michael Wicklein and Caleb Fitzpatrick provided outstanding research assistance.
Resources
Site Topics
Keywords
- tariffs ,
- inflation ,
- import prices ,
- indirect imports
JEL Codes
- F40 ,
- E65 ,
- E31
Citation
Barbiero, Omar, and Hillary Stein. 2025. “The Impact of Tariffs on Inflation.” Federal Reserve Bank of Boston Current Policy Perspectives 25-2.
Related Content
New Mortgage Designs for an Inflationary Environment
Understanding Inflation and the Implications for Monetary Policy: A Phillips Curve Retrospective
The Impact of Inflation
The Impact of Global Shipping Cost Surges on US Import Price Inflation