New England Economic Conditions Through March 4, 2025 


Key Takeaways
- The unemployment rate in New England climbed 0.3 percentage point from December 2023 to December 2024, with rate changes ranging from a 1.2 percentage point increase in Rhode Island to a 1.2 percentage point decrease in Connecticut. In addition, each New England state’s layoffs and discharges rate increased from a year earlier, suggesting a recent weakening of labor demand.
- Consumer Price Index (CPI) inflation in New England rose to 4 percent (year over year) in January 2025, up from 3.3 percent in December 2024 and twice as high as the 2 percent rate observed in January 2024. The latest inflation reading in part reflects robust increases in medical-care and shelter prices. CPI inflation in the United States was more moderate, but still elevated, at 3 percent (year over year) in January 2025.
- New England’s private industry workers experienced a decline (–0.6 percent) in real wages and salaries from the fourth quarter of 2023 to the fourth quarter of 2024. Real wages and salaries of private industry workers increased at least modestly in all other census divisions and in the United States on average. New England’s negative real wage growth reflects a combination of below-average growth in nominal wages and salaries and above-average CPI inflation.
- New England’s labor force participation rate rose a full percentage point from December 2023 to December 2024, while the US rate remained unchanged for the same period. New England’s increase in participation was driven partly by a decrease in the retirement rate after a period of elevated retirements precipitated by the COVID-19 pandemic.
Sign up for new research and data on the New England economy.
Payroll Employment
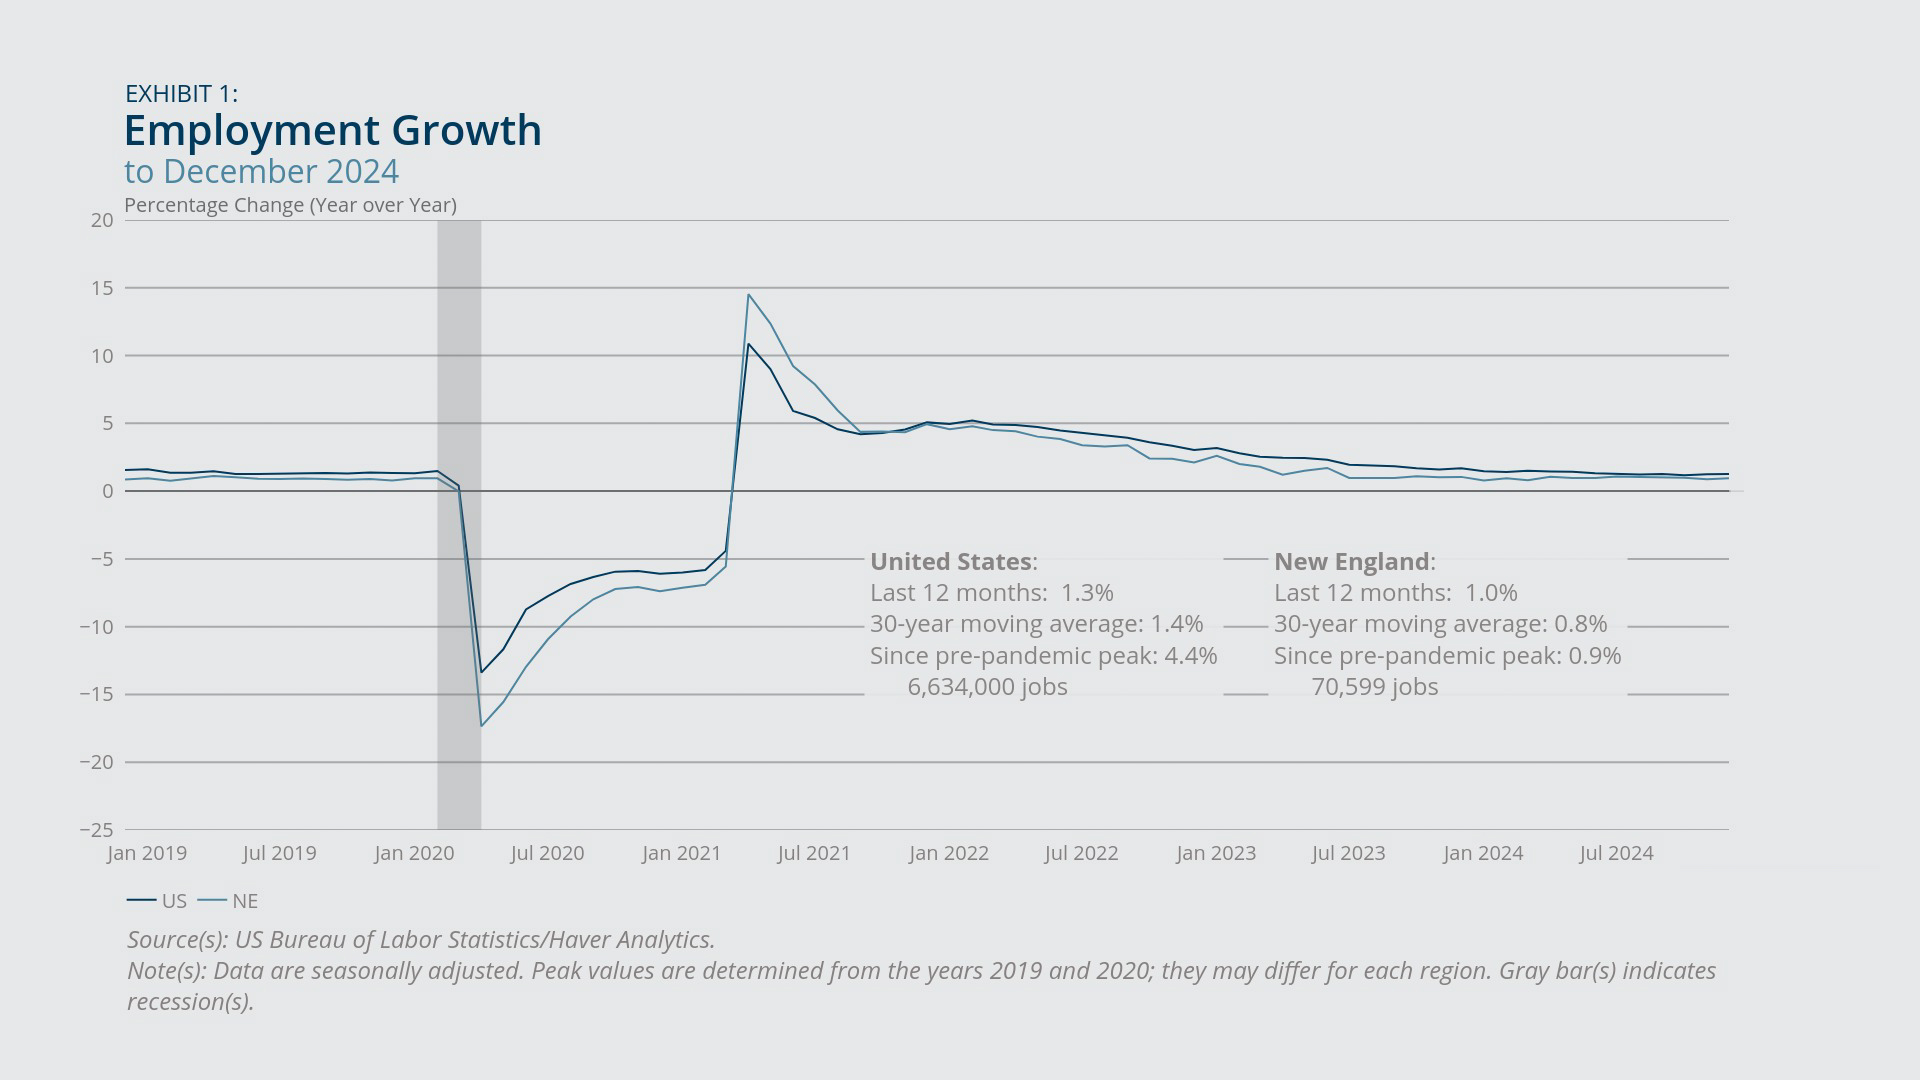
- Employment growth (on a year-over-year basis) edged up slightly in New England in December 2024 from the previous month,1 staying above its 30-year moving average by a small margin. The latest reading was nonetheless slightly lower than the comparable rate observed in December 2023. (Exhibit 1)
- The recovery of payroll employment relative to February 2020 varies considerably across New England states, with Vermont and Massachusetts just barely back to pre-pandemic levels and Maine and New Hampshire well above their respective pre-pandemic benchmarks. (Exhibit 2)
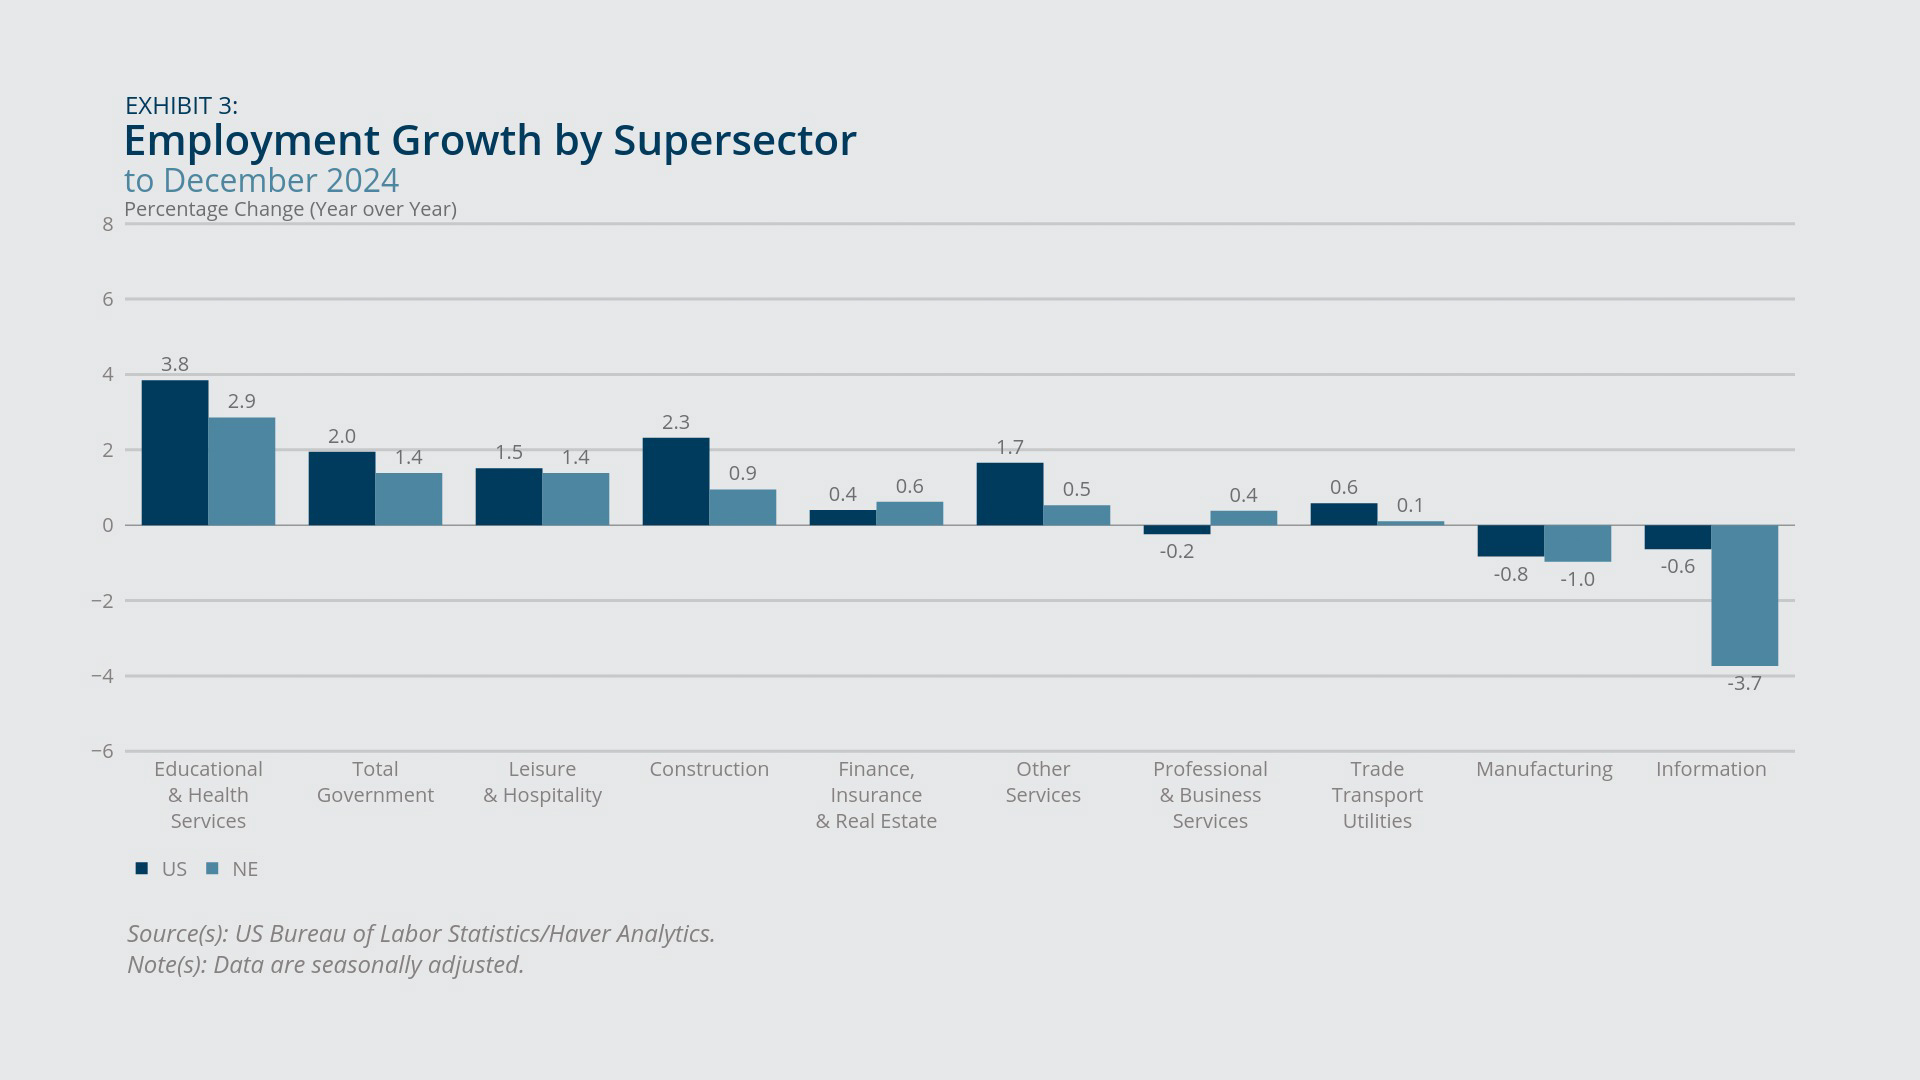
- The region’s information sector experienced considerable job losses from December 2023 to December 2024 (–3.7 percent employment growth). Information jobs declined nationwide over the same period, but by a substantially smaller margin (–0.6 percent employment growth). Manufacturing employment also declined in both New England and the United States over the same period (Exhibit 3).
The employment growth rate in New England (Exhibit 1) has been fairly stable, remaining in the vicinity of 1 percent, since July 2023, a month that marked the end of a two-year-plus period of above-average employment growth in the region. For the United States, year-over-year employment growth in December 2024 rose slightly, to 1.3 percent from the previous month’s 1.25 percent rate. However, the latest reading for US employment growth revealed a slowdown from the 1.7 percent rate recorded in December 2023.2
Comparing payroll employment levels in December 2024 with their respective February 2020 levels (Exhibit 2) shows that the net employment change varies widely across the New England states. New Hampshire has seen the strongest employment recovery in the region, up more than 4 percentage points compared with February 2020, but employment in Vermont fell short of its pre-pandemic benchmark by 1,400 jobs. Since June 2024, employment has increased sharply in New Hampshire, whereas other New England states have posted either slow employment growth (Connecticut and Rhode Island) or outright declines in payroll jobs (Maine, Massachusetts, and Vermont).
The information sector in New England posted steep job losses from one year earlier, extending a pattern of negative job growth that has persisted since May 2023 (Exhibit 3). Information sector jobs nationwide also have declined (year-over-year) since May 2023, although the pace of information job losses in the United States has moderated toward zero in recent months. An example of information job losses involved media conglomerate Gannett, which enacted at least three rounds of layoffs in the region in 2024, the most recent in November in Massachusetts following the closure of an online review site.3 Separately, analysts speculate that AI threatens a variety of information sector jobs moving forward, including roles in entertainment and data processing.4
Manufacturing employment also declined from the previous year, but at similar rates in New England (–1 percent) and the United States (–0.8 percent). The strongest employment growth occurred in the education and health services sector, up 2.9 percent in New England and 3.8 percent nationally. Within New England’s education and health services sector (exhibit not shown), health-care and social-assistance employment increased more rapidly (3.3 percent from December 2023 to December 2024) than did education-services employment (up 1.1 percent for the same period). Nationwide over the same period, health-care and social-assistance employment also grew more rapidly (4.2 percent) than education-services employment (1.9 percent).

Federal Reserve Bank of Boston
Federal Reserve Bank of Boston
Federal Reserve Bank of Boston
Unemployment and Layoffs
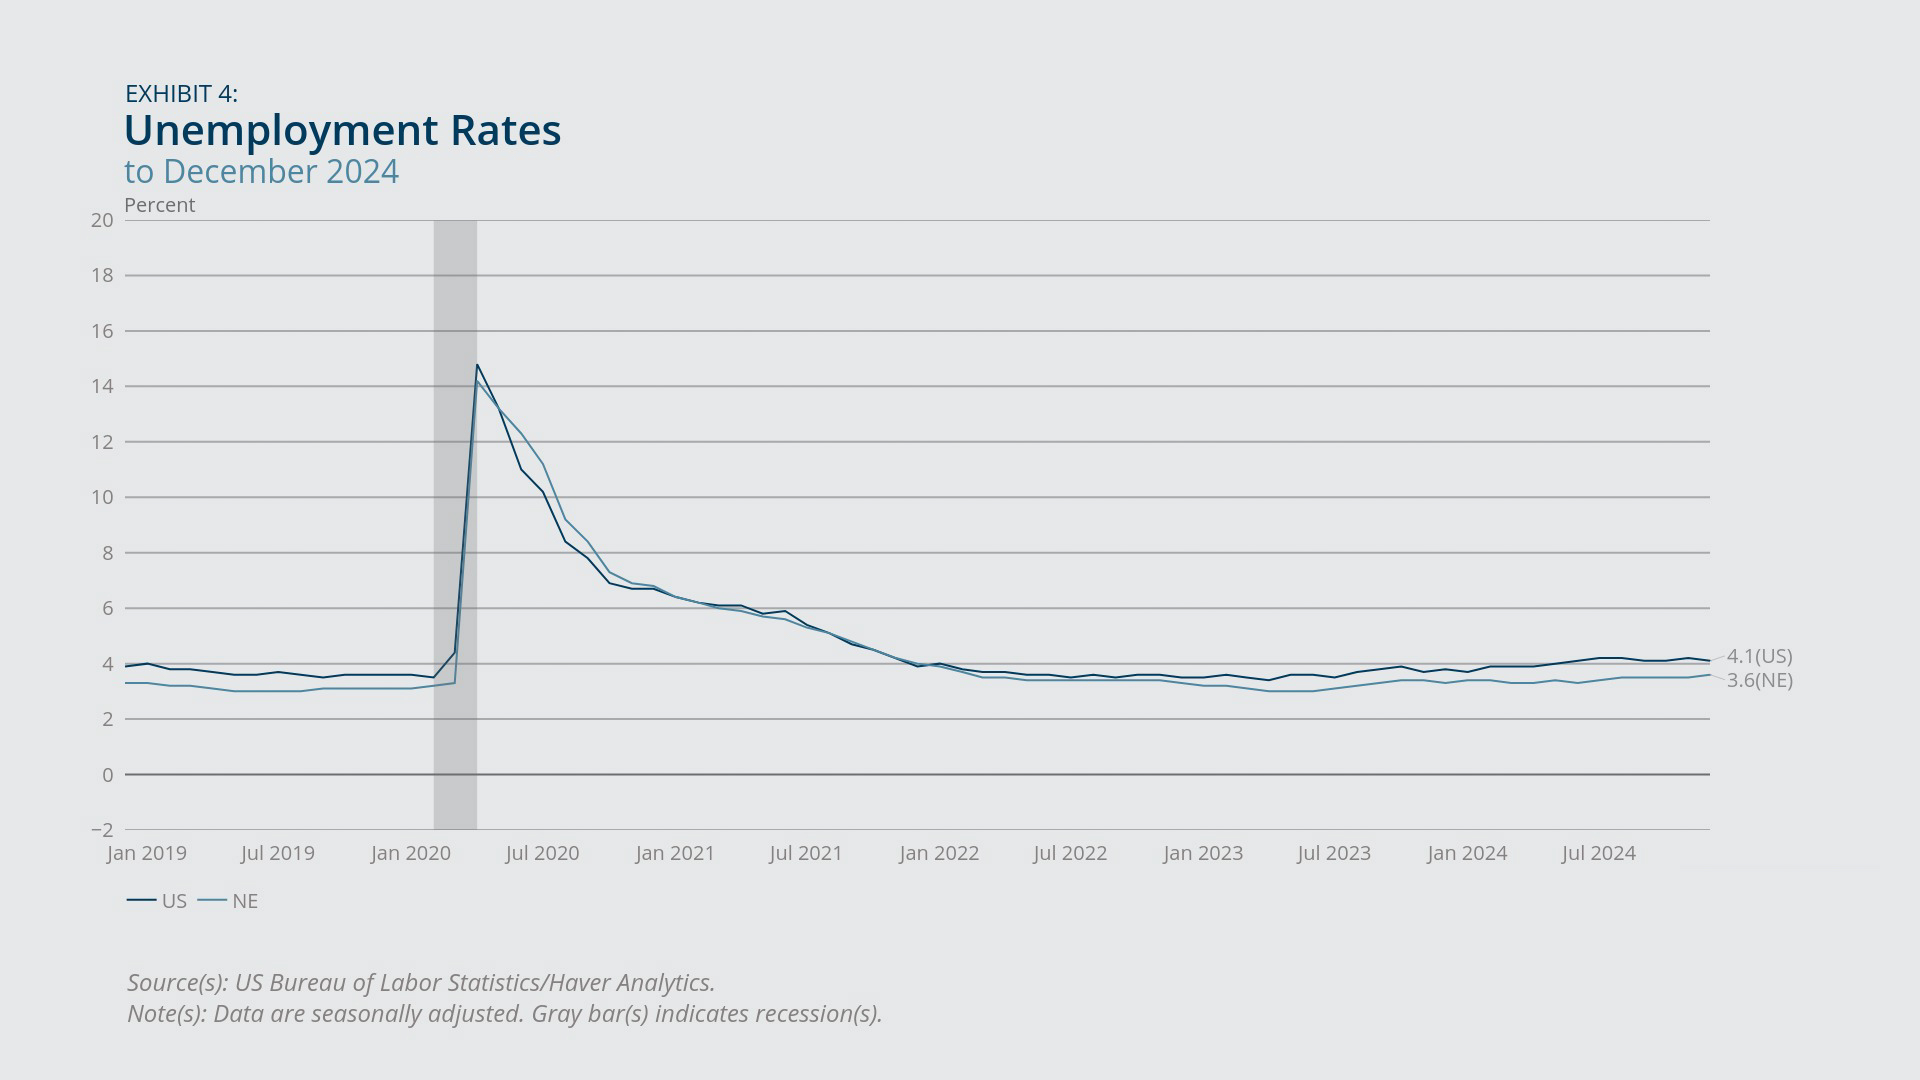
- The unemployment rate in New England edged up 0.1 percentage point in December 2024 from the previous month and was up 0.3 percentage point from the previous December. The US rate was up similarly from a year ago despite posting a slight monthly decline in December (Exhibit 4).
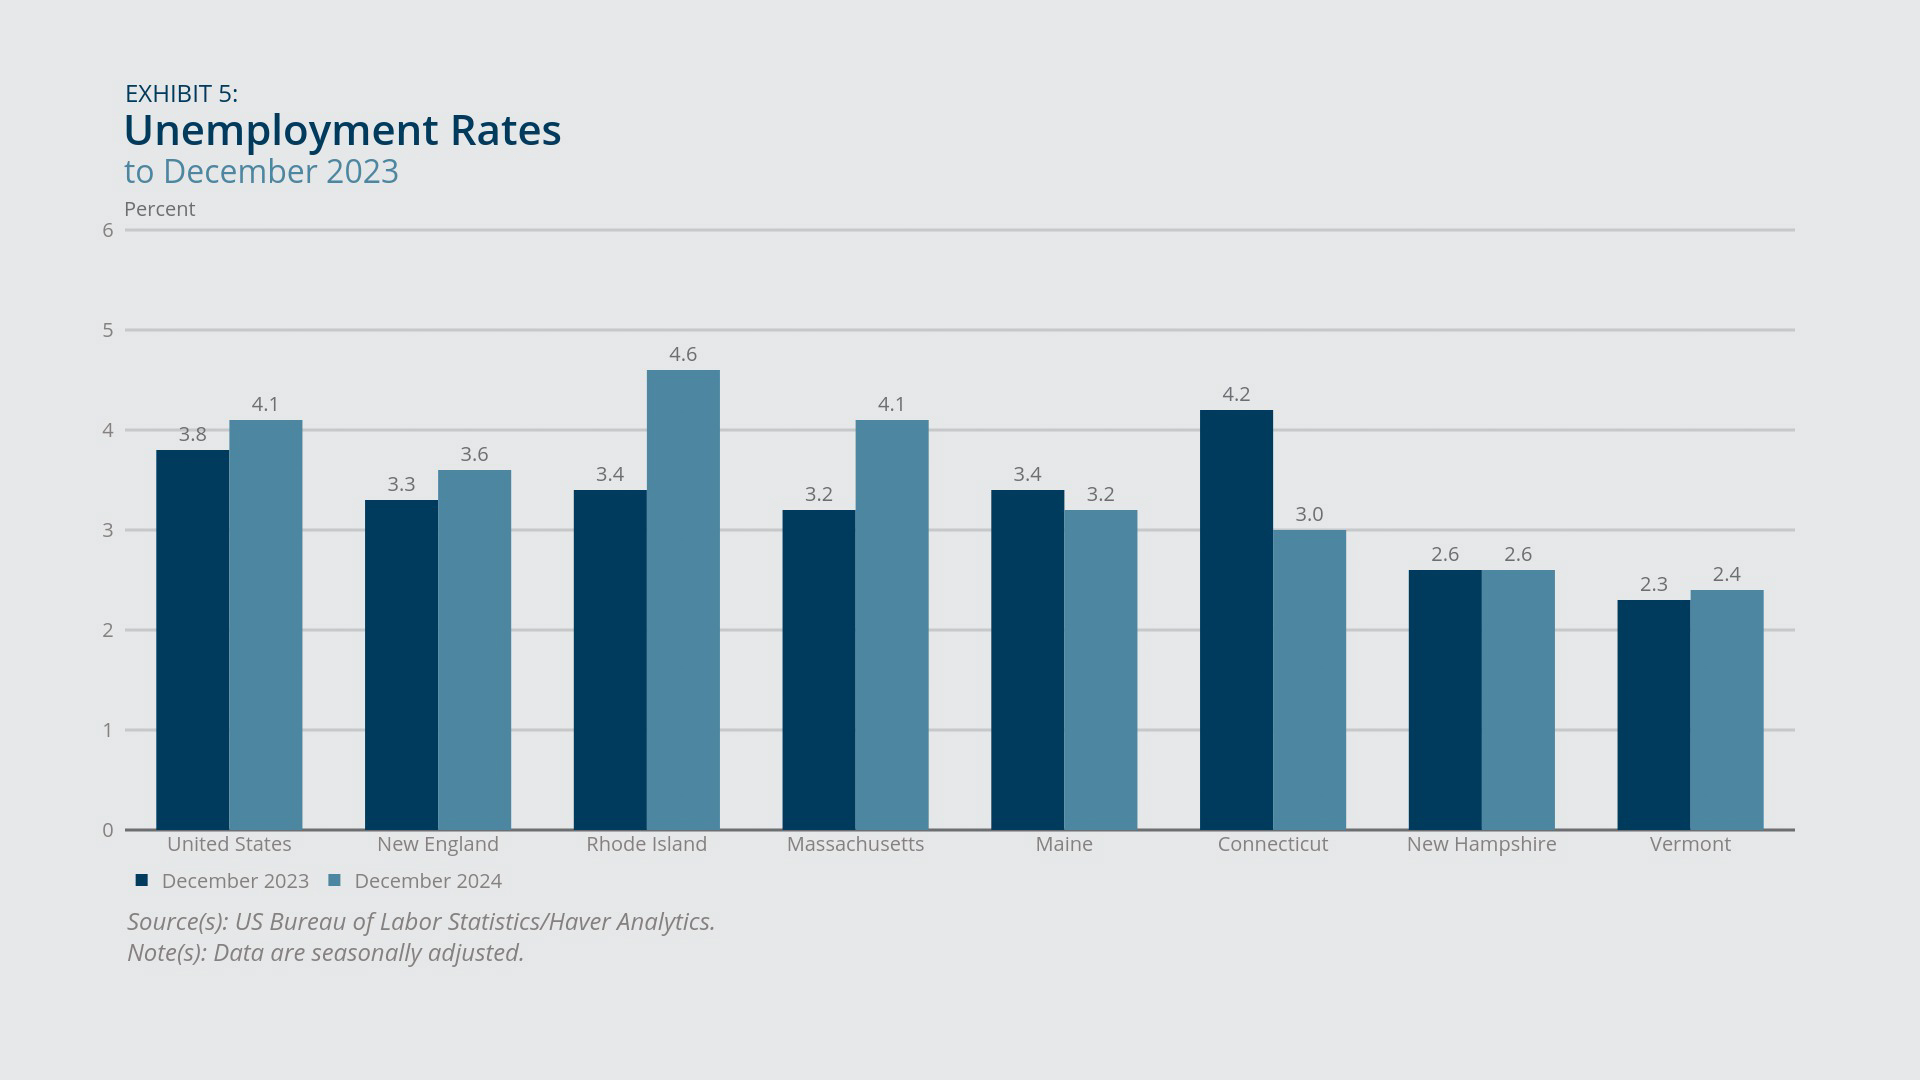
- Rhode Island’s unemployment rate increased more than a full percentage point in December 2024 from the previous December (Exhibit 5), while Connecticut’s rate decreased by more than 1 percentage point over the same period.
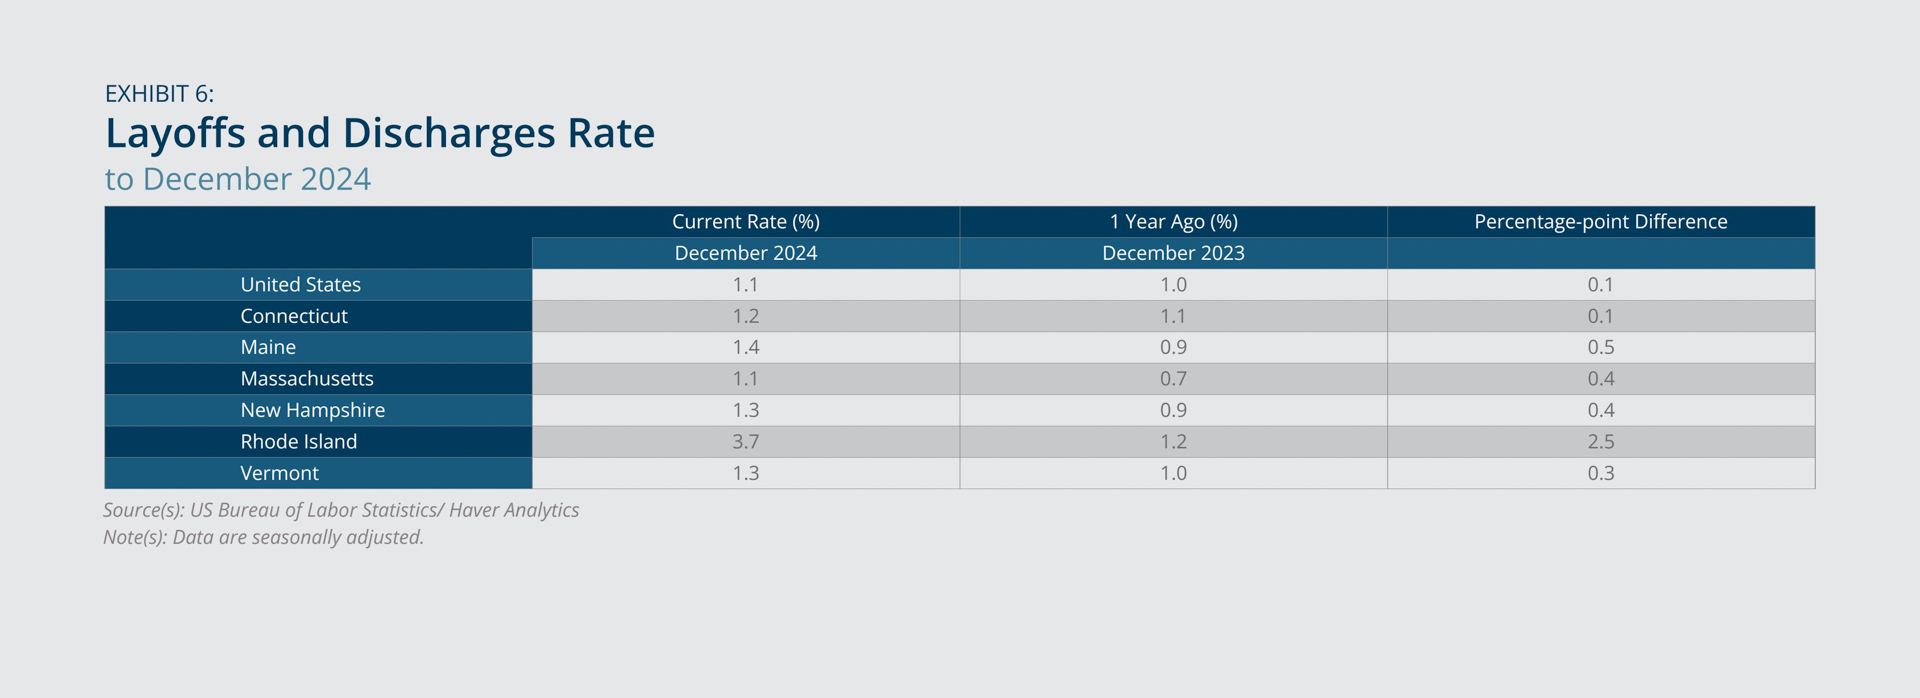
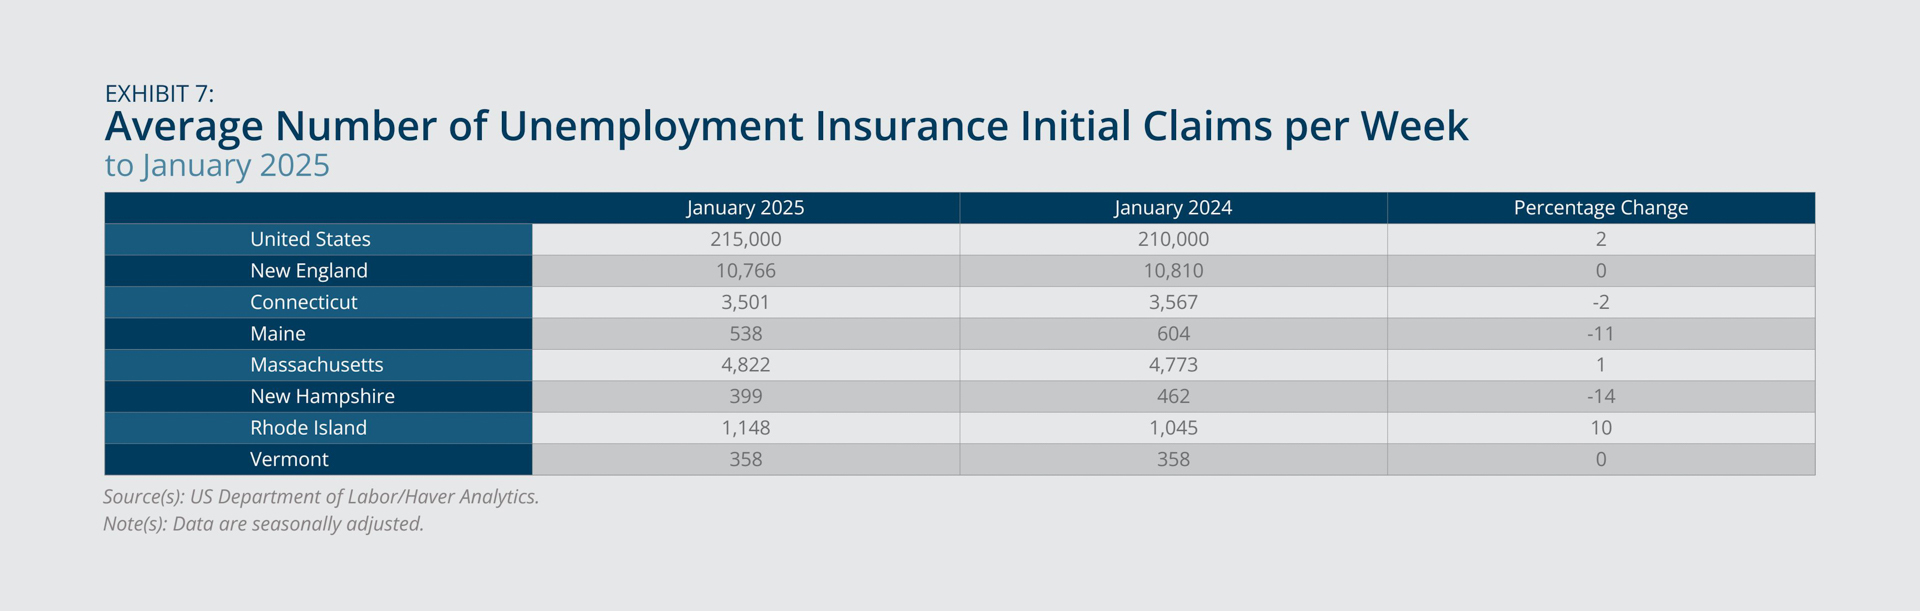
- The layoffs and discharges rate increased in December 2024 from a year earlier in all six New England states and in the United States (Exhibit 6). The increase was especially large in Rhode Island, a state that also experienced an increase in initial unemployment insurance claims in January from a year earlier (Exhibit 7), suggesting a deteriorating labor market in the state.
New England’s unemployment rate edged up in December 2024 to 3.6 percent (from 3.5 percent in November), while the corresponding US rate ticked down 0.1 percentage point, to 4.1 percent, in the same month. New England’s rate and the US rate each increased 0.3 percentage point from the previous December and exceeded their respective post-pandemic (April 2023) lows by 0.6 and 0.7 percentage point, respectively. Unemployment rate changes in the 12 months ending in December 2024 varied widely across the New England states (Exhibit 5), ranging from a 1.2 percentage point increase in Rhode Island to a 1.2 percentage point decrease in Connecticut.
Two indicators suggest that recent layoffs contributed to the rise in Rhode Island’s unemployment rate in 2024. The layoffs and discharges rate (Exhibit 6) in Rhode Island surged to 3.7 percent in December 2024, up from 1.2 percent a year earlier. The other New England states and the United States also experienced increases in their respective layoffs and discharges rates over the same period, but by margins of 0.5 percentage point or less. In addition, initial unemployment claims in Rhode Island in January 2025 exceeded the number from the previous January by 2 percent, whereas initial claims for New England as a whole were unchanged in January from a year earlier (Exhibit 7). According to public advance notices of large layoffs, at least two manufacturing firms announced significant layoffs in Rhode Island in 2024,5 and in November 2024, the Gannett media group (mentioned in the previous section) announced 136 layoffs associated with the planned closure of the Providence Journal’s printing facility.6 However, it is not clear how many of those announced layoffs have shown up yet in the state’s layoffs and discharges rate, which is based on real-time job separations.
Leaders in every New England state have expressed grave concerns about the impact of potential cuts to National Institutes of Health (NIH) funding on employment, given the importance of such funding in supporting the region’s many prominent academic institutions, hospitals, and other research facilities.7 In fiscal year 2024, New England received a total of $4.9 billion in NIH grant funds, accounting for an estimated 0.33 percent of the region’s GDP. Funding levels ranged from $56 million in Vermont to $3.5 billion in Massachusetts.
Federal Reserve Bank of Boston
Federal Reserve Bank of Boston
Federal Reserve Bank of Boston
Federal Reserve Bank of Boston
Labor Force Participation and Retirement
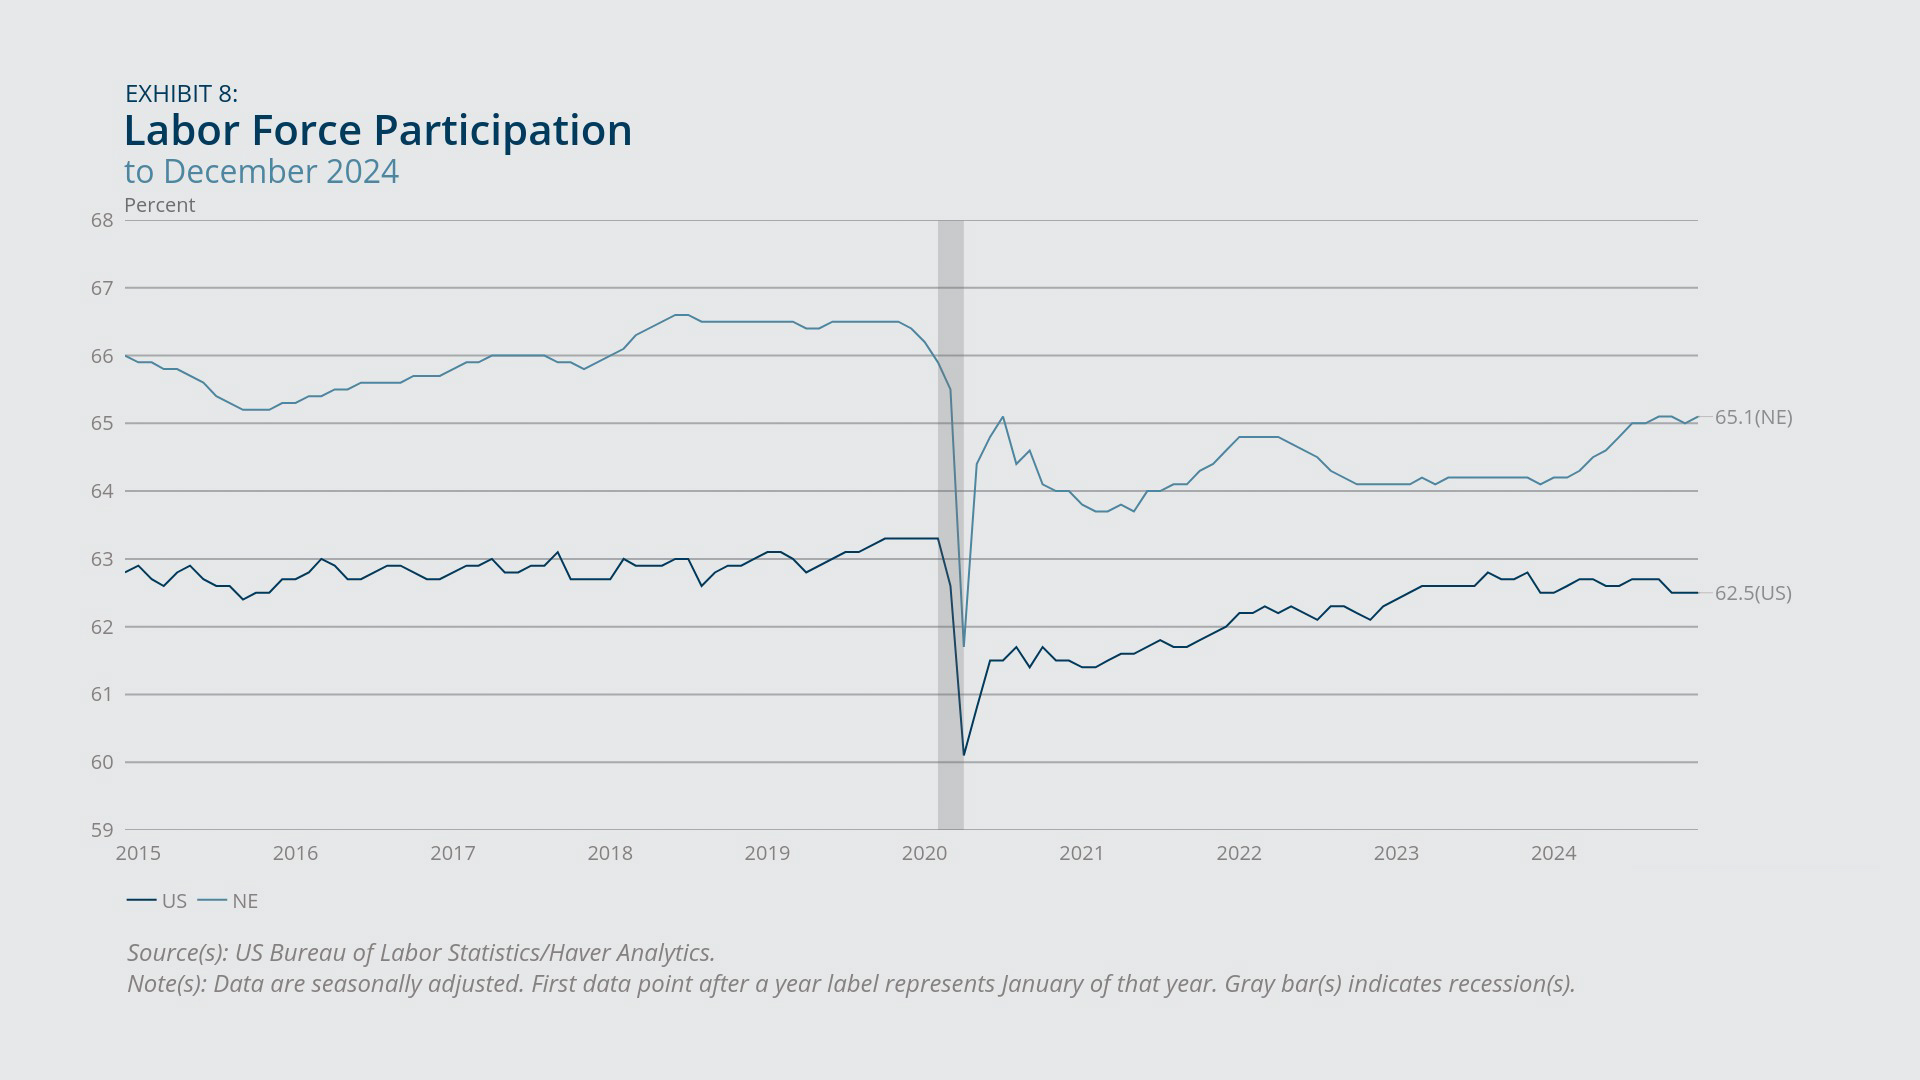
- New England’s labor force participation rate (Exhibit 8) rebounded in 2024 after a period of stagnation, rising a full percentage point on net over the 12 months ending in December. The corresponding rate in the United States was unchanged in December 2024 from the previous December.
- Labor force participation increased at least slightly in each New England state in December 2024 from a year earlier, with the highest increase occurring in Massachusetts (Exhibit 9).
- Early retirements imposed a drag on labor force participation during the COVID-19 pandemic, both regionally and (slightly less so) nationally, but as of 2024, the retirement rate in the region appeared to have normalized considerably (Exhibit 10), supporting increased labor force participation.
New England’s labor force participation rate increased 1 percentage point from December 2023 to December 2024 (Exhibit 8), reaching 65.1 percent and matching its highest level since March 2020. Over the same period, the US labor force participation rate was stable on net at 62.5 percent but reached as high as 62.7 percent in five separate months of 2024.
Within the region, Massachusetts experienced the largest over-the-year increase in labor force participation in December 2024, rising 1.6 percentage points, while Connecticut’s rate edged up only 0.1 percentage point (Exhibit 9). The labor force participation rate increased 0.9 percentage point in Rhode Island over the same period, suggesting that increased labor supply, in addition to weakening labor demand, may have contributed to the state’s rising unemployment in 2024.
The recent improvement in New England’s participation rate, and the relative stagnation in the US rate, can be linked partly to patterns in retirement rates (Exhibit 10). For both New England and the United States, the exhibit shows the actual (yearly average) retirement rates from 2016 through 2024, together with counterfactual retirement rates that capture just the impact of population aging on retirement rates over time, holding retirement rates by age at their average levels (for either New England or the United States, respectively) as of 2019. For example, New England’s actual retirement rate in 2021 well exceeded what would have been expected based solely on changes in its age distribution since 2019, implying that many people in 2021 retired earlier than expected for their age. Furthermore, the “early retirements” gap appears larger in New England than in the United States from 2021 through 2023.
However, New England’s retirement rate fell outright in 2024 compared with 2023, landing only slightly above the counterfactual rate. The US retirement rate increased further in 2024 but also edged closer to its counterfactual rate. The decrease in New England’s retirement rate in 2024 contributed to increased labor force participation over the same period, while the rising retirement rate in the United States offered no such boost to participation at the national level.8 Despite that contrast, the pronounced early retirement phenomenon of 2021 through 2023 appears to be fading, both regionally and nationally.
In Massachusetts, the above-average increase in that state’s labor force participation rate in the 12 months ending in December 2024 also seems to relate, at least in part, to a decline in the state’s retirement rate over the same period (exhibit not shown). In addition, Massachusetts experienced significant further international immigration in 2024 (on top of elevated inflows during the 2022–2023 period) that helped to boost the state’s total population.9 Whether such immigration also contributed to higher labor force participation in 2024 is an open question. Two facts suggest that it may not have been a major factor: (1) analysis of the US Census Bureau’s American Community Survey (ACS) data through 2023 indicate that recent migrants exhibit below-average rates of labor force participation compared with native-born individuals and earlier migrants;10 and (2) in either Massachusetts or the region as a whole, the foreign-born share of the labor force appears to have declined in 2024 relative to 2023 (according to a comparison of annual averages in the Integrated Public Use Microdata Series from the Current Population Survey [IPUMS-CPS]; exhibit not shown). However, both of those findings should be interpreted with caution given shortcomings in the ability of those data sources to fully capture and accurately represent international immigrants.
Federal Reserve Bank of Boston
Federal Reserve Bank of Boston
Federal Reserve Bank of Boston
Employment Cost Indexes for Private Industry Workers11
- Among the nine census divisions as of 2024:Q4, New England experienced the slowest 12-month growth rate in nominal (that is, current dollar) wages and salaries for private industry workers, and the same statement applies to New England’s growth rate of nominal total compensation (Exhibit 11).
- In 2024:Q4, New England was the only census division to experience negative 12-month growth in real (that is, constant dollar) wages and salaries and negative growth in real total compensation, both for private industry workers (Exhibit 11).
New England lagged all other census divisions and the US average in terms of 12-month growth in nominal wages and salaries (and, separately, total compensation) of private industry workers, according to Employment Cost Index (ECI) data (Exhibit 11). Below-average growth in nominal total compensation emerged in the region in 2023:Q1 and has persisted since then, following years in which the region kept pace with the United States on that measure (on average). New England shows 12-month declines in real total compensation (and, likewise, in real wages and salaries) in each of the last three quarters of data (ending in 2024:Q4), following three quarters of positive real growth rates. The negative real growth rates in wages and salaries and total compensation in New England reflect a combination of below-average nominal growth rates in those measures, together with the fact (described below) that New England experienced above-average consumer price inflation relative to the United States throughout most of 2024. Despite New England’s below-average ECI growth rates relative to the United States and other census divisions in recent data, the region’s 12-month ECI growth rates (whether nominal or real and for either wages and salaries or total compensation) nonetheless increased in 2024:Q4 compared with the previous quarter.
Federal Reserve Bank of Boston
Inflation
- CPI inflation in New England (Exhibit 12) surged to 4 percent (year over year) in January 2025, up from 3.3 percent in December 2024 and twice as high as the 2 percent rate observed in January 2024.
- CPI inflation in the United States was more moderate than in New England but edged up to 3 percent (year over year) in January 2025 (from 2.9 percent in December 2024) after falling to as low as 2.4 percent in September 2024.
Although spiking egg prices have received much news coverage recently, egg prices are not the biggest factor behind the recent, outsized Consumer Price Index (CPI) inflation surge in New England. In January 2025, New England’s year-over-year core inflation rate, which strips out food and energy prices, was even higher, at 4.6 percent, than the headline (all-items) inflation rate of 4 percent (Exhibit 13). Similarly for the United States, core prices rose 3.3 percent in January 2025 from a year earlier (versus the 3 percent increase in the all-items CPI).
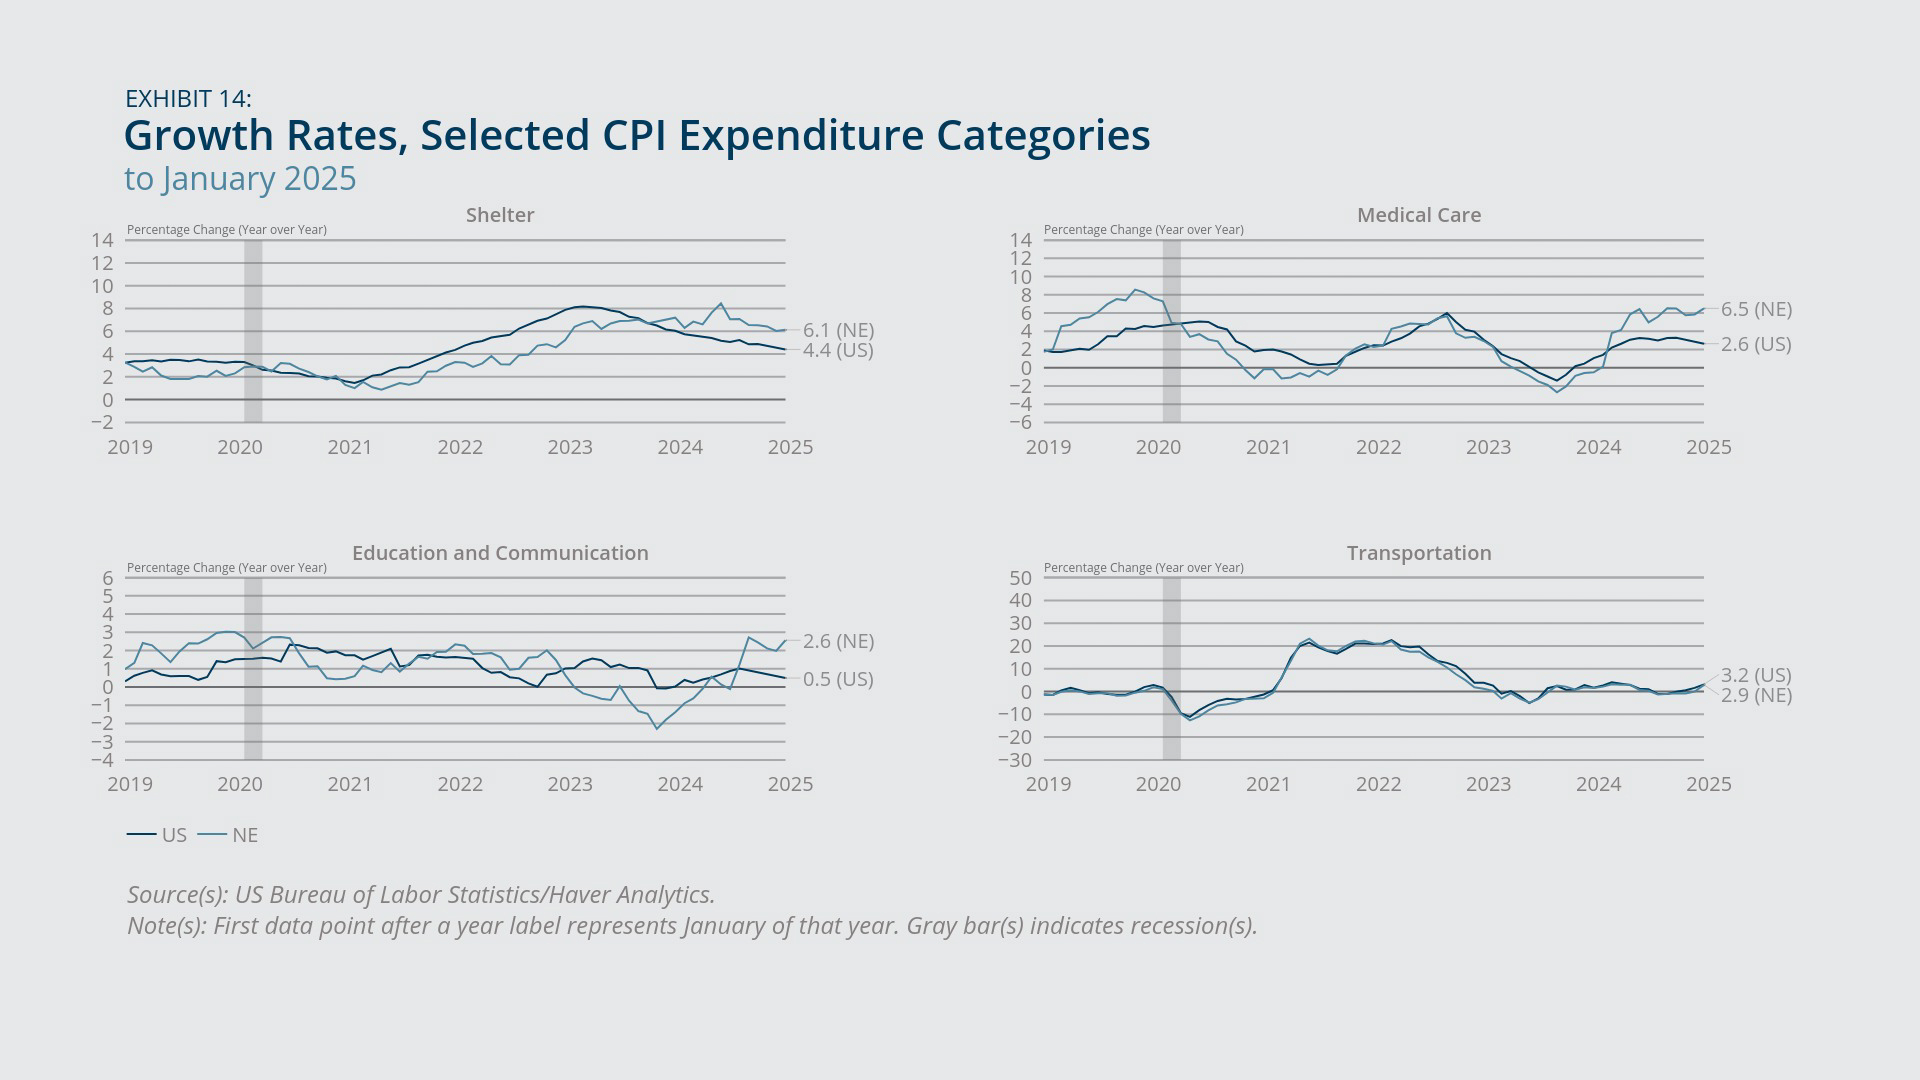
Regarding individual components of the CPI, year-over-year price growth in New England was considerably higher than in the United States for medical care, shelter, and education and communication (Exhibit 13). As Exhibit 14 shows, the growth rates in each of those spending categories in New England in 2024 either consistently exceeded the corresponding growth rate for the United States (in the case of shelter) or surpassed the US growth rate in 2024 and then remained higher (for medical care and education and communication). In comparison, year-over-year growth in transportation prices has been virtually identical in New England and the United States since at least 2019, as gasoline and vehicle prices do not exhibit large or persistent regional variations. (Exhibit 14) Nonetheless, a look at price changes just since December 2024 (to January 2025) shows that New England’s transportation prices increased the most (relative to other prices) and increased at a much faster rate than did US transportation prices for the same month (Exhibit 13).
Federal Reserve Bank of Boston
Federal Reserve Bank of Boston
Federal Reserve Bank of Boston
Endnotes
- The most recent State Employment and Unemployment report from the Bureau of Labor Statistics (BLS), which is the source for employment and unemployment outcomes for New England and its individual states, includes data only through December 2024. State-level employment and unemployment data for January 2025 will be released on March 17, 2025; corresponding data for February 2025 will be released on March 28, 2025. National employment and unemployment data from the BLS are currently available through January 2025; the February 2025 national data will be released on March 7, 2025. The following URL provides links to all the economic news release schedules from the BLS: https://www.bls.gov/bls/newsrels.htm#schedules.
- The payroll employment data for the United States in Exhibits 1 and 2 incorporate the benchmark revisions published by the BLS in early February. The revisions resulted in a roughly –0.4 percent reduction in the average employment level in 2024. The year-over-year employment growth rate in December 2024 was revised downward from 1.4 percent to 1.3 percent, amounting to 610,000 fewer jobs (on a seasonally adjusted basis) in December 2024 than originally estimated. Benchmark revisions to regional and state employment data will be released on March 17, 2025.
- See Dallas Gagnon, "Gannett to Lay Off More than 70 Mass. Employees amid Cambridge Closure," MassLive, September 3, 2024. https://www.masslive.com/news/2024/09/gannett-to-lay-off-more-than-70-mass-employees-amid-cambridge-closure.html
- See Caleigh Wells, “In a Weak Jobs Report, This Sector Did Worse, FYI,” Marketplace, August 2, 2024. https://www.marketplace.org/2024/08/02/us-economy-added-jobs-last-month-but-not-in-this-sector/; and Kieran Gilmurray, “What Jobs Are Most at Risk by AI?” The AI Journal, August 22, 2024. https://aijourn.com/what-jobs-are-most-at-risk-by-ai/#:~:text=1.,that%20far%20surpasses%20human%20capabilities.
- See Wheeler Cowperthwaite, "These Two RI Companies Are Laying Off a Combined 263 Local Workers. Here’s What We Know," Providence Journal, August 1, 2024. https://www.providencejournal.com/story/business/2024/08/01/rhode-island-warn-notices-unemployment-layoffs-ennovi-kirby-perkins-construction/74633362007/
- See Dallas Gagnon, "Major Media Company, Gannett, to Close Providence Journal Printing Facility: 100+ Facing Layoffs," MassLive, November 15, 2024. https://www.masslive.com/news/2024/11/major-media-company-gannett-to-close-providence-journal-printing-facility-100-facing-layoffs.html
- See, for example, Jack Perry, “Brown University: Federal Cuts Would Cost More than 200 Jobs and End Research Projects,” Providence Journal, February 12, 2025. https://www.providencejournal.com/story/news/local/2025/02/12/brown-university-national-institute-health-cuts-have-devastating-impact-research-rhode-island/78420006007/
- Although not shown, additional analysis for New England using the IPUMS-CPS data finds that 12-month flows into retirement from the labor force declined significantly in New England in 2024 from the previous year, while 12-month flows back into the labor force from retirement increased, if modestly. Those changes contributed to a lower retirement rate and a higher labor force participation rate in New England in 2024 compared with 2023.
- Mapping Mass Migration, “:New 2024 Census Estimates Show Surge in Population Growth, with Considerable Caveats,” Pioneer Institute, February 2025. https://pioneerinstitute.org/wp-content/uploads/PNR-607-Mass-Migration-Newsletter-02122025.pdf
- Mary A. Burke and Nathaniel R. Nelson, “Why New England’s Labor Force Participation Has Been Recovering So Slowly since the COVID-19 Pandemic,” New England Public Policy Center Research Report 25-1.
- Measures of wage and salary growth or total compensation growth based on Employment Cost Indexes control for changes in employment composition over time.

 About the Authors
Mary A. Burke,
Federal Reserve Bank of Boston
Mary A. Burke is a principal economist and policy advisor with the New England Public Policy Center in the Federal Reserve Bank of Boston Research Department.
Email: Mary.Burke@bos.frb.org
Nathaniel R. Nelson,
Federal Reserve Bank of Boston
Nathaniel R. Nelson is a research assistant with the New England Public Policy Center in the Federal Reserve Bank of Boston Research Department.
Kelly Jackson,
Federal Reserve Bank of Boston
Kelly Jackson is a senior data analyst in the Federal Reserve Bank of Boston Research Department.
Resources
Keywords
- Regional economy ,
- Economic Conditions ,
- New England ,
- NEPPC